Fibonacci Support In View For The USD/CAD


Today’s action in WTI crude oil futures has been a breath of fresh air to the Canadian dollar. Pricing for the USD/CAD has fallen significantly, bringing an area of Fibonacci support into play. With a bit of luck, price will continue to grind south and create a nice trading opportunity later today.
USD/CAD Technicals
After this week’s poor crude oil inventories cycle, August WTI is on the march to $75.00. As a result, the USD/CAD is off considerably, illustrating a resurgence of the CAD.
+2018_06_28.png)
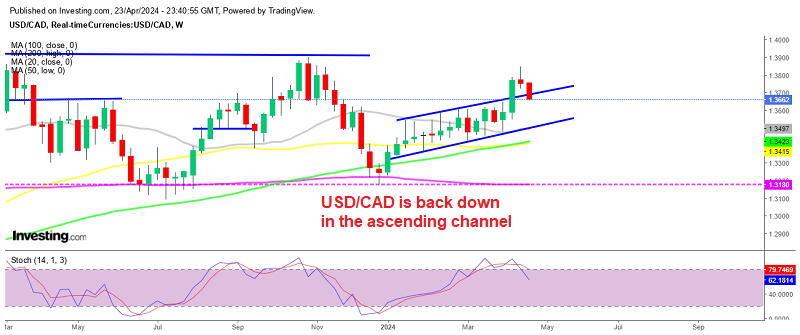
Here are the levels to watch in the USD/CAD for the remainder of the session:
- Support(1): 38% Retracement, 1.3219
- Support(2): Bollinger MP, 1.3098
- Support(3): Daily SMA, 1.3002
Bottom Line: The distance of Support (2) and (3) from current price is instructive of the prevailing uptrend in the USD/CAD. The Bollinger MP and Daily SMA are nearly parallel and at a 45-degree upward trajectory well below price. This is an indication of a strong bullish presence. A buy from above the 38% Fibonacci retracement of the current wave (1.3219) is a solid way to join the uptrend on the daily time frame.
For the remainder of the week, buys from 1.3226 offer a good location to the long. Using an initial stop at 1.3194, this trade may be executed using a 1:1 or 1:2 risk vs reward scenario. Either way, the long play returns 32 or 64 pips.
As of this writing, August WTI crude oil futures are pushing intraday highs above $73.75. Look for this trade to go live by today’s session close.