FOMC Places Bearish Pressure on Gold – Can We Expect $1,197?


On Wednesday, the Federal Reserve upgraded its evaluation of the economy, hinting at another rate hike as soon as September. It strengthens the dollar while placing a bearish impact on the bullion market. Can gold go after $1,197? Let’s find out…
Hawkish FOMC – Impact on Gold
At a two-day meeting, the Fed decided unanimously to keep its benchmark federal funds rate in a limit of 1.75% and 2%. In a report, the Fed perceived that job gains and economic activity have been “great.” Consequently, the gold prices seem set for further pain, as the investors moved their investments to higher premium paying securities like the dollar itself.
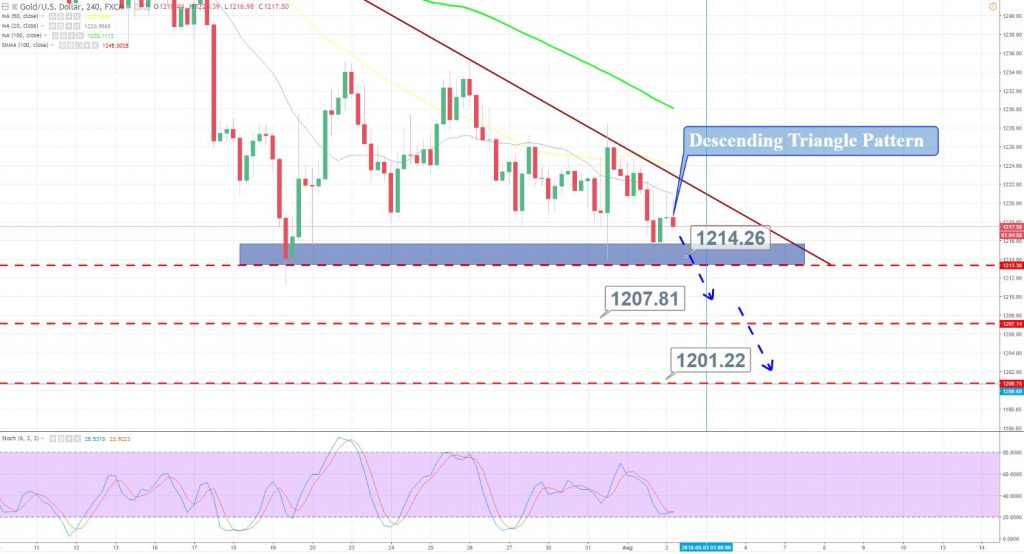
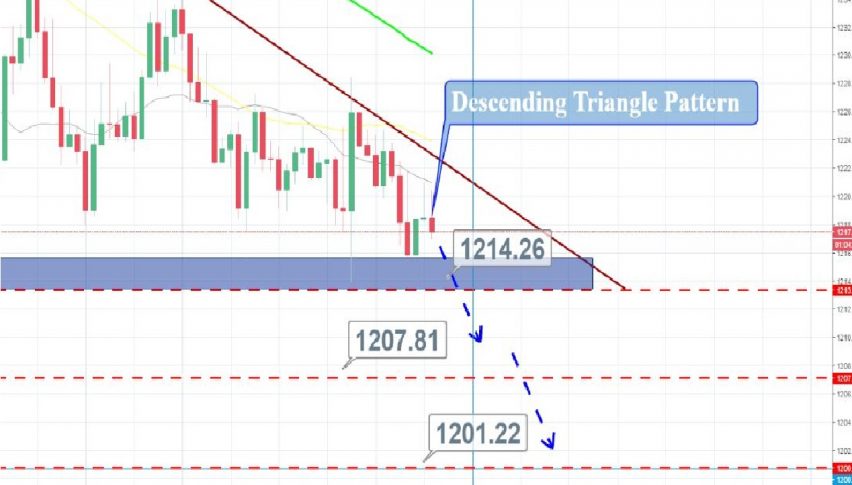
Gold – 4 Hour Chart
At the moment, gold is facing a resistance near $1,222 along with a support near $1,213. The 50 – periods EMA is supporting the bearish trend. The thing is, gold has formed a descending triangle pattern which typically breaks on the lower side.
In order to see a continued downward trend, gold should violate the major support level of $1,213. On the violation of $1,213 gold prices can travel towards $1,207 and $1,197.
Gold – XAU/USD – Trade Idea
Today, the idea is to stay bearish below $1,220 to target $1,214/13 with a stop near $1,222. Good luck!