Forex Signals Brief August 21st – 27th – Central Banker Speeches In Focus
Welcome back to another exciting week. We may experience some serious fluctuations in the market this week due to the speeches from the ECB
Welcome back to another exciting week. We may experience some serious fluctuations in the market this week due to the speeches from the ECB president Mario Draghi and Fed Chair Janet Yellen on Thursday. Here is what to expect…
Top Economic Events This Week
US Dollar – USD
On Thursday, Fed Chair Yellen is due to deliver a speech entitled "Financial Stability" at the Federal Reserve Bank of Kansas City Economic Symposium, in Jackson Hole at 16:00 (GMT). This has important market implications in its own right, especially if she suggests that asset prices are overvalued.
In addition, Core Durable Goods Orders m/m will be released at 12:30 (GMT). It's forecasted at 0.4%, slightly higher than the previous figure of 0.1% and thereby likely to support the Buck.
Eurozone – EUR
This week, we have two speeches from the ECB President Draghi.
– On Wednesday at 7:00 (GMT), Draghi is expected to deliver opening remarks at the 6th Lindau Meeting in Economic Sciences, in Germany.
– On Friday, Draghi will be accompanying Yellen at the Federal Reserve Bank of Kansas City Economic Symposium, in Jackson Hole at 19:00 (GMT).
Great Britain Pound – GBP
On Thursday, the Office for National Statistics will release Second Estimate GDP q/q with a neutral forecast of 0.3%. The figure shows the change in the inflation-adjusted value of all goods and services produced by the economy and is considered the broadest measure of economic activity and the primary gauge of the economy's health.
Top Trade Setups This Week
EUR/USD – Descending Triangle Pattern
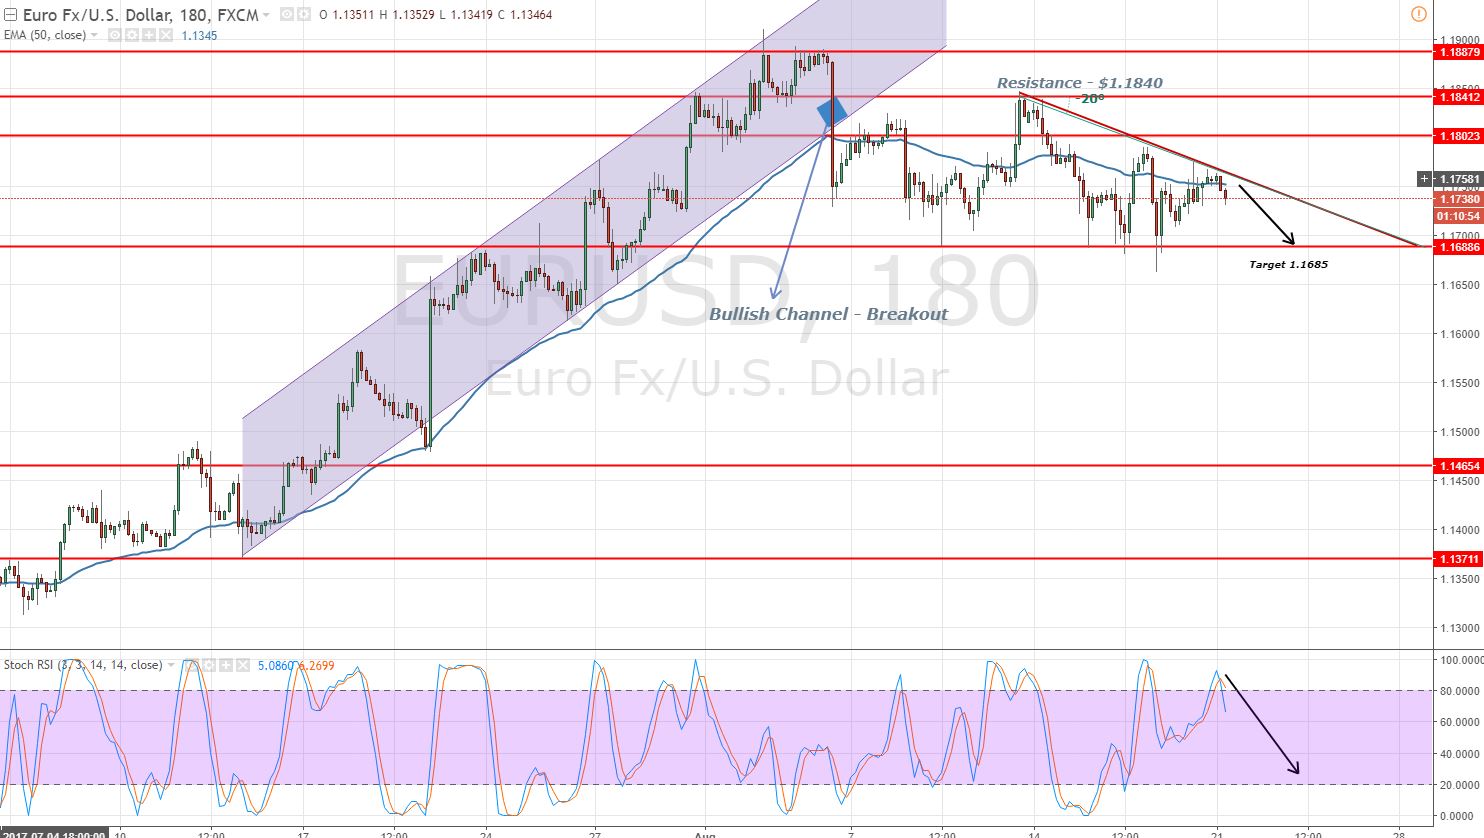
Taking a quick look at the 3-hour chart of EUR/USD, we can see a descending triangle pattern, demonstrating investors' bearish sentiment. For now, the pair is encountering resistance at $1.1750 and is likely to continue trading bearish towards $1.1690.
 EURUSD – 3-Hour Chart – Descending Triangle Pattern
The Stochastic is coming out of an overbought range, supporting the pair's bearish bias. The 50- periods moving average is also providing resistance at $1.1750. We should look for sell entries below these levels.
EUR/USD – Key Trading Levels
Support Resistance
1.1685 1.1752
1.1643 1.1820
1.1575 1.1862
EUR/USD Trade Plan
I will be looking to enter a sell position below $1.1750 in order to target $1.1705 with a stop loss above $1.1770. On the other hand, buying above $1.1680 seems to be a good idea.
NZD/USD – Head & Shoulder Pattern In Play
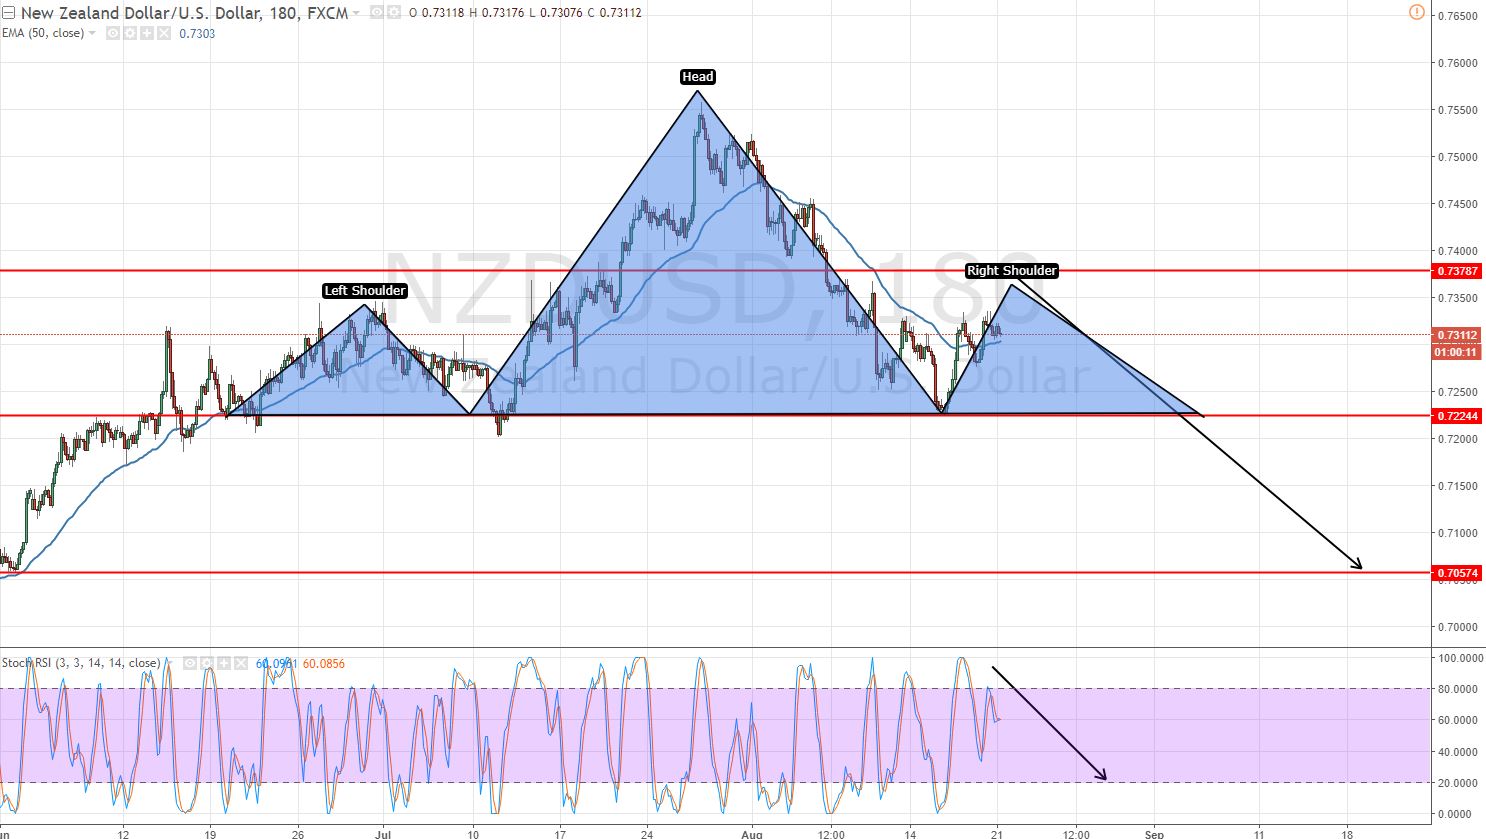
Looking at the 4-hour chart, the NZDUSD has formed a Head and Shoulder pattern with a neckline at $0.7405. A break below this will help sellers target $0.7335. However, above $0.7405, the pair has the potential to stay bullish until $0.7450. Odds are higher for the bearish breakout. Check out our FX Leaders head and shoulder trading strategy for a better understanding of the trade idea.
NZDUSD – 3-Hour Chart – Head & Shoulder Pattern
NZD/USD- Key Trading Levels
Support Resistance
0.7360 0.7493
0.7309 0.7575
0.7227 0.7626
NZD/USD Trade Plan
The idea is to stay in sell below $0.7400 in order to target $0.7275, making sure to move your stops at break even after the trade enters the green zone. Good luck traders and keep following for exciting forex trading signals and market updates.
- Check out our free forex signals
- Follow the top economic events on FX Leaders economic calendar
- Trade better, discover more Forex Trading Strategies
- Open a FREE Trading Account
 EURUSD – 3-Hour Chart – Descending Triangle Pattern


