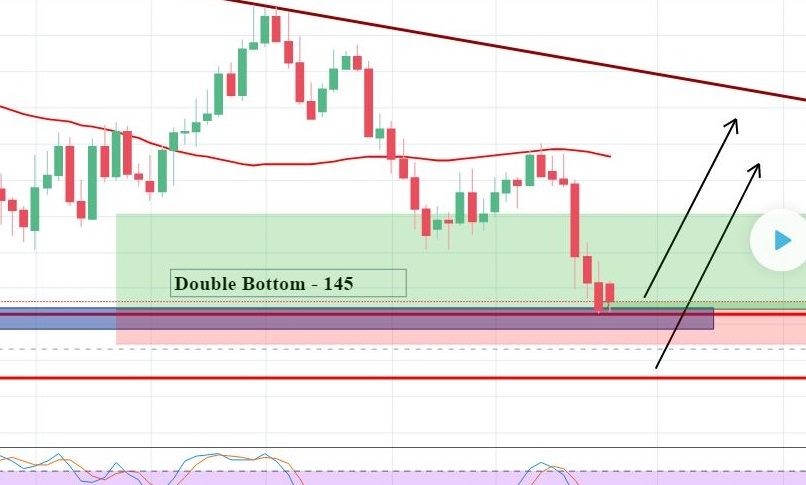
GBP/JPY Dips to 145.150 – Challenging Double Bottom Level


The cross currency GBP/JPY is trading bearish at 145.200 on the back of strengthening Japanese yen. The bid tone around the safe haven currency Yen strengthened during the Asian session after the 10 years treasury yield dipped to a 6 week low. The Japanese stock market index Nikkei is also down, suggesting the state of concernover European politics.
The ongoing geopolitical tensions between the United States, North Korea, Israel, and Palestine are keeping the demand for haven assets at peak.
I’m expecting, you should be clear about fundamental reasons behind a bearish trend in GBP/JPY. Now let’s speak about the technical analysis.
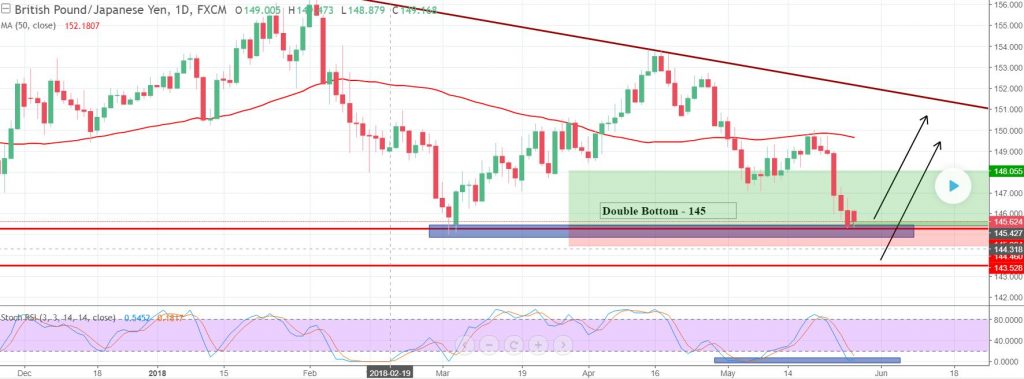
The bearish momentum in GBP/JPY seems to get weaker as the pair has reached a solid support level of 144.950. Basically, it’s a double bottom support level and for your information, this kind of pattern is known for a bullish reversal.
So, can we expect a bullish reversal now? Well, the technical indicators are signaling bullish bias. Especially, the RSI is below 20 which means sooner or later sellers may get exhausted.
Support Resistance
145.4 146.04
145.19 146.25
144.87 146.57
Key Trading Level: 145.72
GBP/JPY – Trading Plan
I’m looking to enjoy the choppy trading by selling below 145.750 and buying above 144.950 with a minimum stop loss of 30 pip. Whereas, the take profit should be 50 pips. Stay in touch for updates on forex trading signals…