GBP/USD, You Know the Trend Is Strong When the 20-SMA Comes Into Play


Yesterday I posted a forex update, talking about moving averages. I highlighted the fact that the smaller the moving averages at play, the steeper the trend is for a forex pair. That’s because it takes time for the bigger moving averages to start moving and catch up with the price, while smaller moving averages are more flexible.
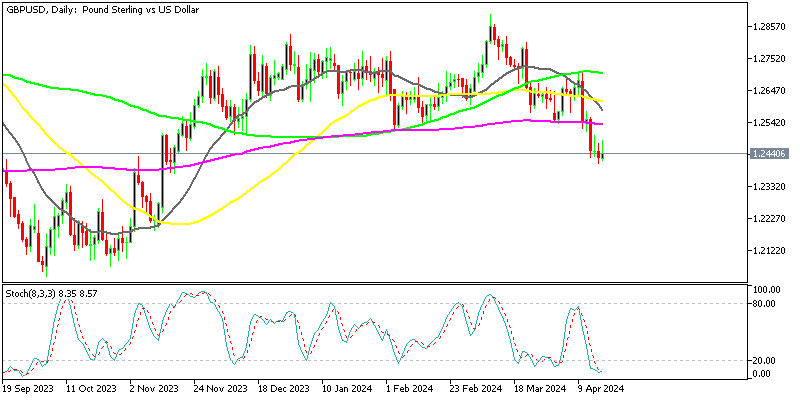
The GBP/USD has been in a strong uptrend for more than a year and in the first half of the month the uptrend picked up pace. Three weeks ago, the 100-SMA (green) was providing support to this forex pair since the trend wasn’t really strong. Once the uptrend became stronger, the 100-SMA fell behind and the 20-SMA (grey) took its place.

Moving averages are great indicators in my book
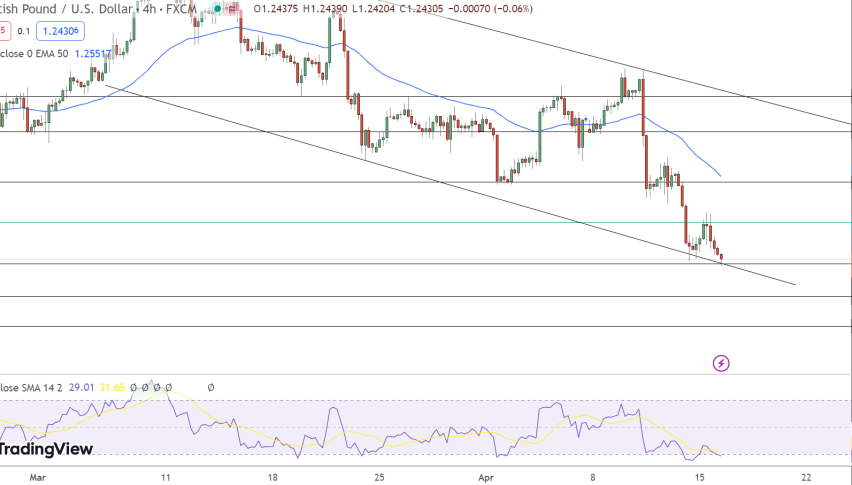
The price reversed at 1.4377 and the GBP/USD began a downtrend. The downtrend has been even steeper, triggered by deteriorating economic data from the UK. Even the 20-SMA couldn’t catch up with the price for about a week, as you can see from the H4 chart above.
But, this moving average reached the price early this morning as the GBP/USD made a pullback higher. I would have gone short there but it happened during the night, so there goes another missed opportunity. Well, we can’t do much now rather than wait for another retrace up so we can sell this pair.
Our long-term sell forex signal looks good now, although we will take a better look at the higher timeframe of this pair in the midday brief.