Our very first trading signal of May on the Nikkei index closed at take profit. Hopefully, this is only the beginning of many good things to come.
Before talking about the Gold, I would like to point out that the precious metal traded exactly as we predicted in out l28th April Morning Brief. It has been confined in the narrow trading range aof $1259/60 – $1267 since last week. Now ,all eyes are on the U.S. economic events. The release of fundamentals from the United States have the potential to trigger a breakout in the yellow metal.
FED Fund Rate & FOMC Meeting
We are expecting a monetary policy decision from the United States on Wednesday. Though it really is a major event, honestly, I don't expect a lot from the Federal Reserve. Especially after the latest rate hike in March, we can't expect an additional rate hike this month. It's quite logical that the Feds are likely to give the economy some time to absorb the previous policy action before offering anything new.
In addition to this, we need to monitor the FOMC statement as it may offer us additional clues regarding June's policy meeting.
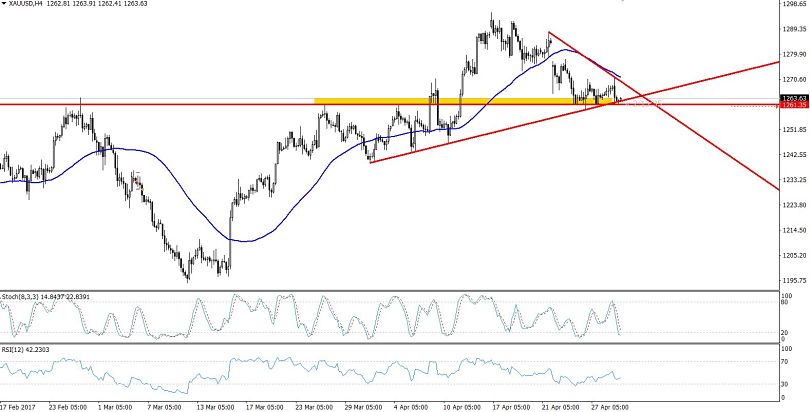
Gold – Descending Triangle Pattern In 4- Hour Chart
Technical Outlook – Intraday
In the 4-hour chart, we can see that the Gold prices are stuck in the descending triangle pattern with a lower limit of $1261 and an upper limit of $1267. In the descending triangle pattern, the prices are meant to break downward, so it would be a good idea to have a sell entry.
The market is extending a strong triple bottom support at the $1260 level. Anyways, the RSI (Relative Strength Index) has crossed below 50, demonstrating that a bearish breakout in the Gold is imminent.
Lastly, we have a bullish trend line in the 4-hour chart which is extending additional support to the precious metal at $1259.
Forex Trading Signal
Considering the above factors, the Gold has left us with two trade options.
- First is to trade the range by adding a buy position above $1259 with a take profit off $1265.
- Second is to add a sell position only below $1258 with a stop loss of $1264 and a take profit of $1249.
Keep following the U.S events!