Gold Retesting Horizontal Resistance $1,328 – Trade The Breakout!


Gold is trading sideways in a narrow trading range of $1,320 – $1,328 today. Unfortunately, it missed our buy limit at $1,321 just by inches and bounced off after printing a low of $1,321.75. Anyways, we may see a breakout during the U.S. session, especially with the release of the U.S. consumer confidence figures. Are you still ready to trade?
Gold – XAU/USD – Technical View
On the 2-hour chart, gold is facing a strong support above a triple bottom level of $1,321. The same level supported the metal back in March and April 2018. 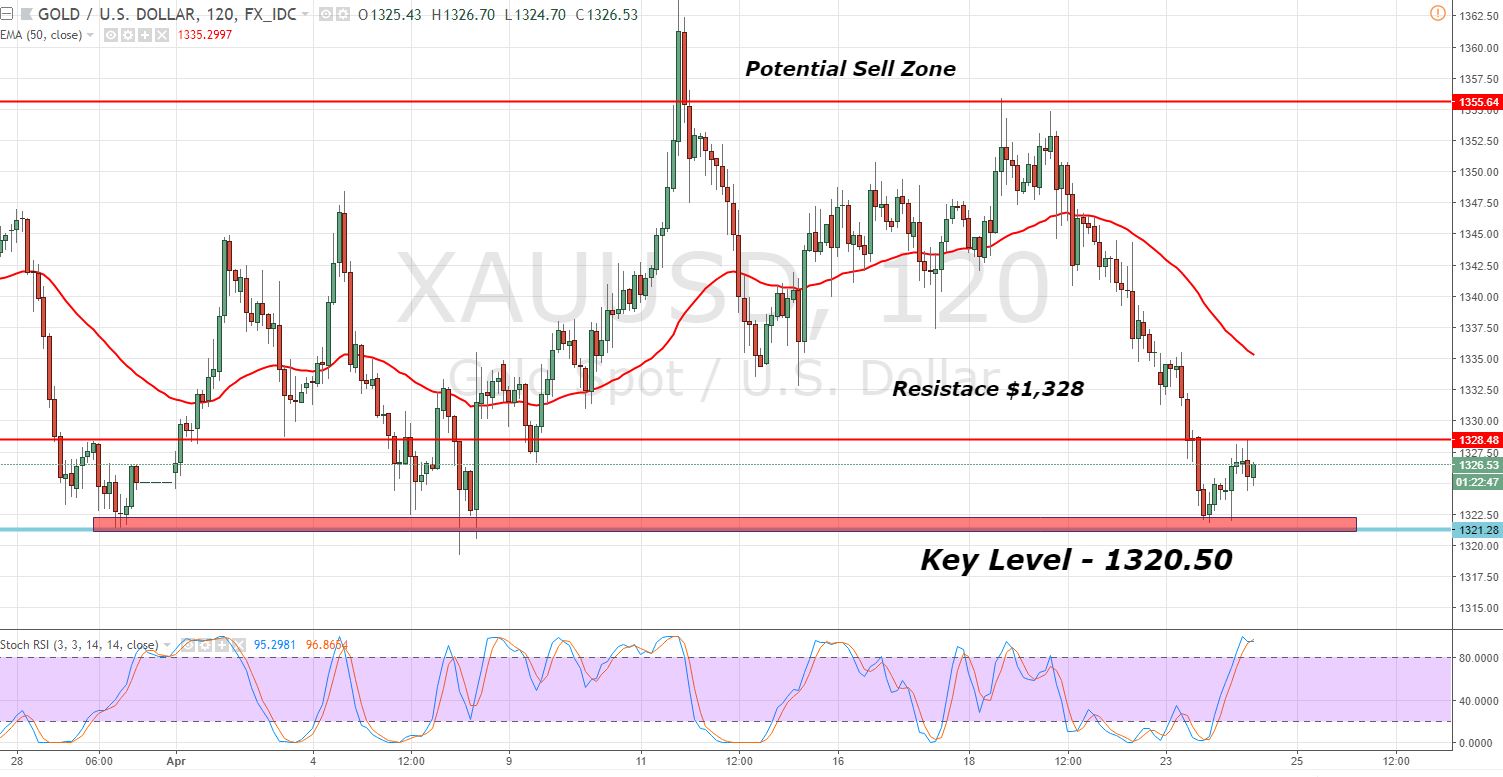
Gold – 2 Hour Chart
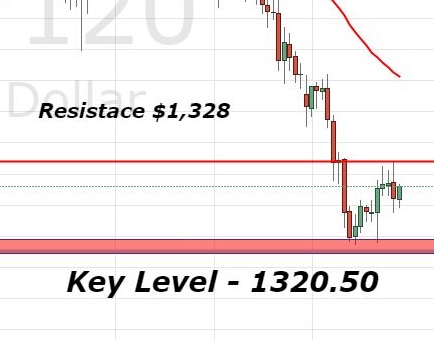
At the moment, gold is facing a nice resistance at $1,328. It has formed a bearish engulfing candle right below the same level ($1,328) which signifies a bearish bias of investors. The leading indicator, RSI, is also trading in the overbought zone.
Support Resistance
1323.97 1334.29
1320.79 1337.47
1315.63 1342.63
Key Trading Level: 1329.13
Gold – XAU/USD – Trading Plan
Today, the idea is to stay bearish below $1,329 with a stop above $1,331 and a take profit of $1,322. However, the market may violate the technical setups on the release of the U.S. consumer confidence numbers during the New York session. Stay tuned for updates!