
⚡Crypto Alert : Altcoins are up 28% in just last month! Unlock gains and start trading now - Click Here
Gold sideways channel breakout – Is it going after $1,192?


What’s up, traders.
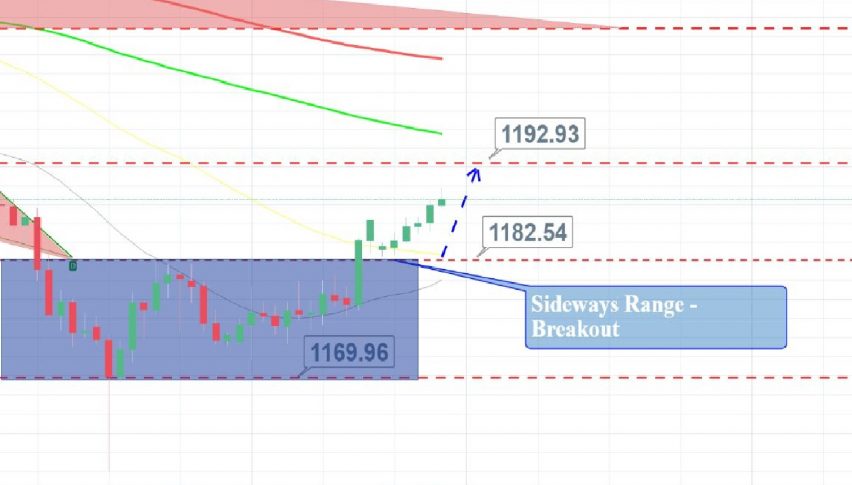
On the 2 hour timeframe, gold has violated the sideways trading range of $1,169 – $1,182. You can also see a bullish crossover on the 50 periods moving average which earlier provided a solid resistance near $1,183.
[fxml_m0re_topics]
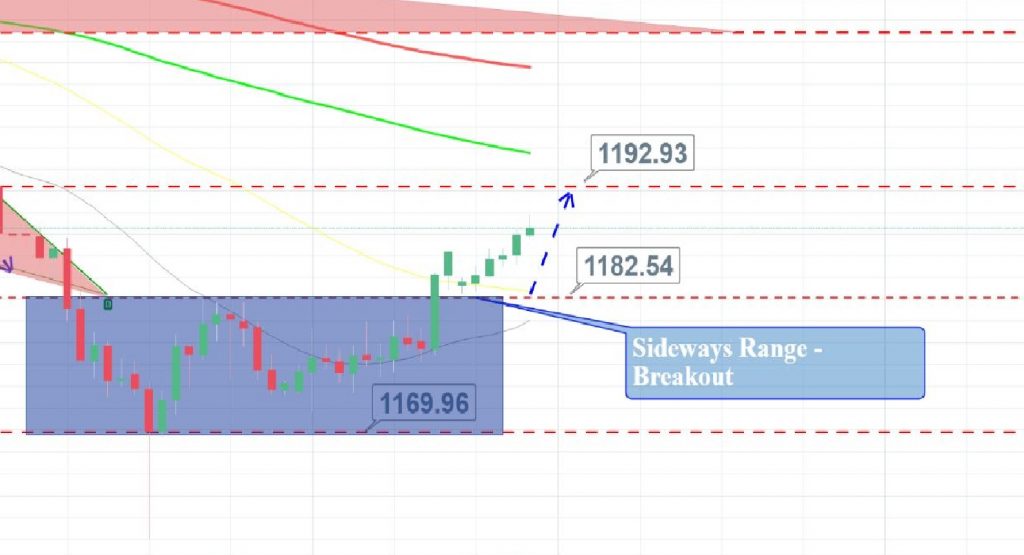
Gold – 2 Hour Chart
In order to encash this breakout, we just shared a forex trading signal to open a buying position near $1187.52 with a stop loss below $1,184 and take profit at $1,190. Anyway, gold is very likely to go after $1,192 and then $1,196.
Do check out FX Leaders weekly support and resistance levels for gold at Aug 20 – 24: Weekly Technical Levels for Gold & WTI Crude Oil. Good luck!
Check out our free forex signals
Follow the top economic events on FX Leaders economic calendar
Trade better, discover more Forex Trading Strategies
Related Articles


Comments
Subscribe
Login
0 Comments


