
Gold Test Back $1200 Level, Will It Sustain?


Since the start of this week, Gold is being steady by making highs of $1202, looking to test back above $1200. After retreating from the last week highs of $1219, and producing the bottom at $1180, intermediate support level.
As we mentioned in yesterdays morning brief, Gold must test above or within the range of $1200 – $1219. Today’s daily closing is important in order to predict whether we should enter into a long-term sell or not.
Last week highs of $1219 must have acted as a strong resistance level. It should not be easy to break this level in just one attempt, especially while keeping in mind important volatile U.S. data coming this week.
Let’s have a look at the Gold daily chart given below: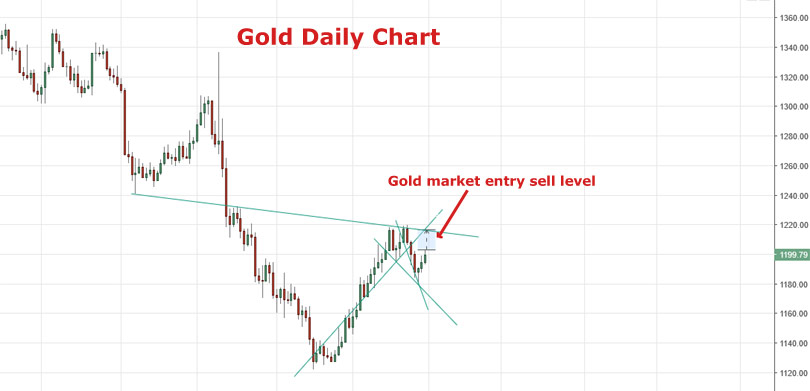 This is the Gold daily chart.
In a technical sense, stay focused on the market divergences, keeping in mind the cautious market environment which is full of volatility. If the U.S data comes in favor of the Fed, gold might plunge down which can be seen under the daily chart given above and the weekly chart provided in yesterdays morning brief.
Good luck!


