
⚡Crypto Alert : Altcoins are up 28% in just last month! Unlock gains and start trading now - Click Here
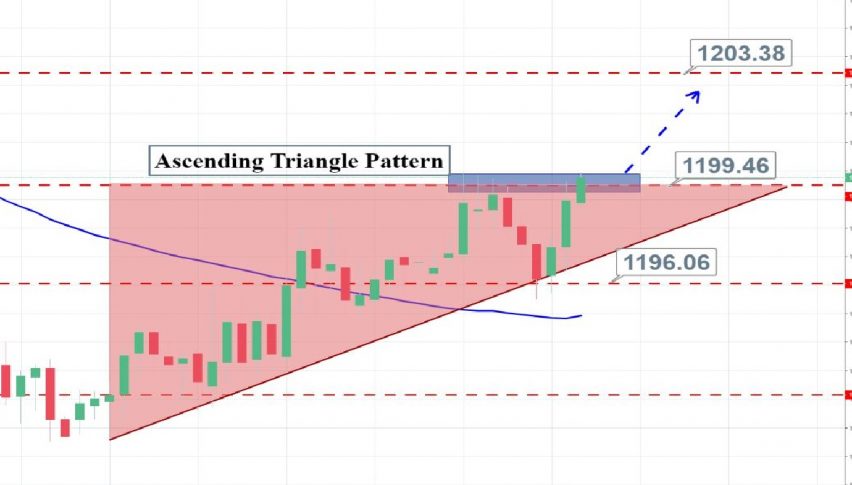
Gold trade doing well – Ascending triangle breakout!


What’s up, traders.
On the London open we shared a quick trading signal on gold to open a buy trade at $1,198 with a target of $1,201. Looks like the trade is doing pretty well and will hit our take profit soon. What’s next?
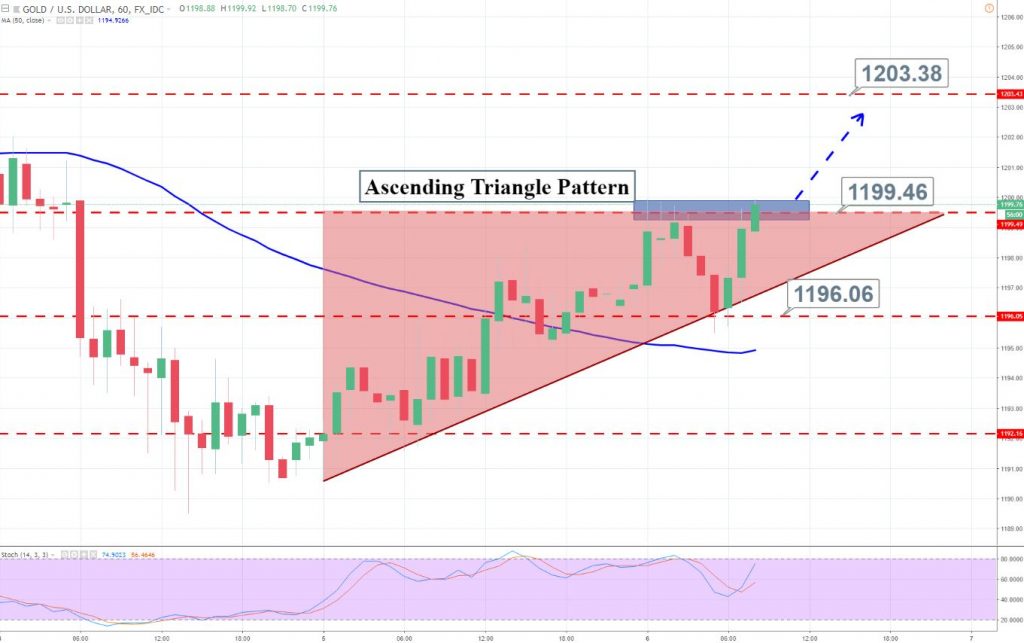
Gold Hour Chart
Gold has formed an ascending triangle pattern which is suggesting a bullish bias of traders. Typically, the ascending triangle pattern breaks out on the upper side. Therefore, gold may continue trading bullish until $1,203. I will see if we can place a sell position at $1,203. Actually, I depend on the closing of candlesticks.
Gold – Key Trading Levels
Support Resistance
1187.32 1198.94
1182.69 1205.93
1171.07 1217.55
Key Trading Level: 1194.31
Check out our free forex signals
Follow the top economic events on FX Leaders economic calendar
Trade better, discover more Forex Trading Strategies
Related Articles

Comments
Subscribe
Login
0 Comments


