Gold Tries to Turn Bullish on Daily Chart, But the Climb Looks Very Weak


GOLD was really bullish in Q2 of this year as it became increasingly clear that the global economy was falling deeper in contraction and the trade war between US and China escalated further. As a result, Gold surged higher and gained around $280 from the bottom to the top.
But, the sentiment improved in September as US and China dialed down their tones, and after they agreed on a partial trade deal last month, which is not official yet, the sentiment improved further. As a result, Gold has been retreating lower during the last few months.
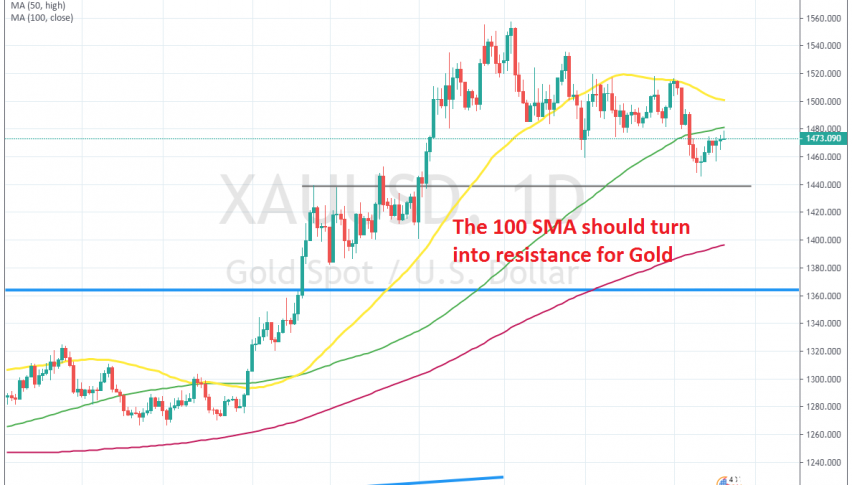
The 50 SMA (yellow) was providing support for some time in September after the first selling wave. But it got broken eventually and turned into resistance in October. After trading in a range during most of October, Gold turned bearish earlier this month and fell pretty close to the previous resistance at $1,440, which should turn into support now.
Gold formed a pin candlestick above it, which is a bullish reversing signal after the decline and the price has been climbing higher since then. Although, the climb seems pretty weak compared to the decline, so this looks more like a retrace before the next move lower.
That would be the normal scenario if US and China sign the “Phase One” deal, but if the talks fall apart, as we are seeing with the recent comments, then Gold might surge higher again. So, it’s a 50-50 trade for Gold right now. The trade deal will decide the near future for Gold.