Gold violates descending triangle pattern – Quick update on trading signal!


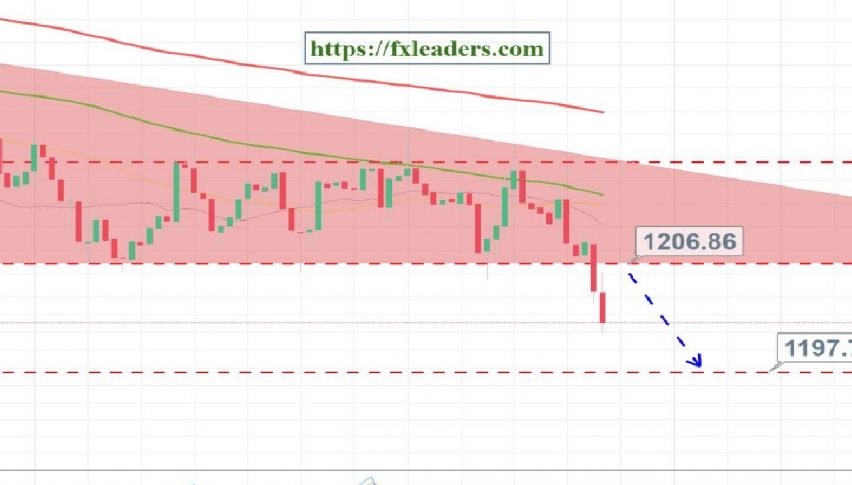
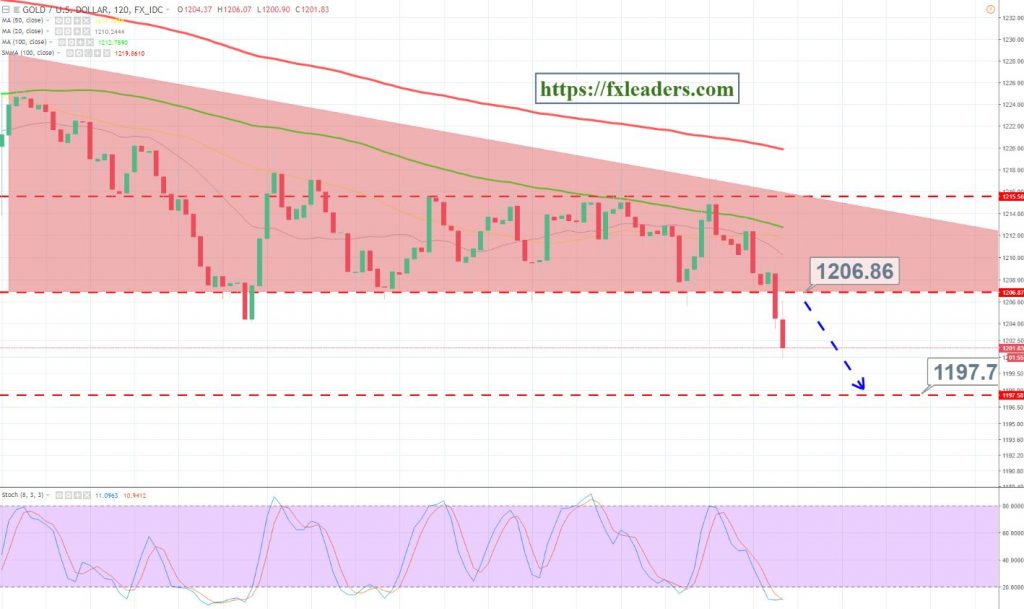
As discussed earlier in our update Gold peaking out descending triangle – Is it going for $1197? Gold has just violated the descending triangle pattern. For the moment, gold has nice chances to target $1,201 and $1,197.
Our second forex trading signal on gold is still active and it’s trading in 20 pips profit. If you haven’t placed it yet, I would recommend holding on a bit until market retraces back to $1,204 area. For those of youwho are already in trade, we suggest you move your stop loss at a breakeven price.
[fxml_m0re_topics]
Why is gold bearish?
Well, the dollar index is gaining an immense amount of attraction. Increased demand is making the Greenback stronger, ultimately making gold and other commodities less attractive for investors. You can refer to FX Leaders Aug 13 – Morning Brief for handy info and analysis on the dollar index.