How Long Will The Downtrend In USD/CAD Continue?


USD/CAD has been in a downtrend over the entire month of May, which means that the Canadian Dollar has been strengthening.
In the first several days of the month, oil prices lost about five cents, but despite that, USD/CAD kept sliding lower. The USD's weakness during that period was a big contributor to the downtrend.
Then, oil prices reversed and the CAD took the driving seat, so the downtrend continued further. As you can see on the H4 chart below, the price has been respecting the trendline. The last time the buyers had a go at the trendline was on Friday afternoon, which coincided with the stochastic being overbought.
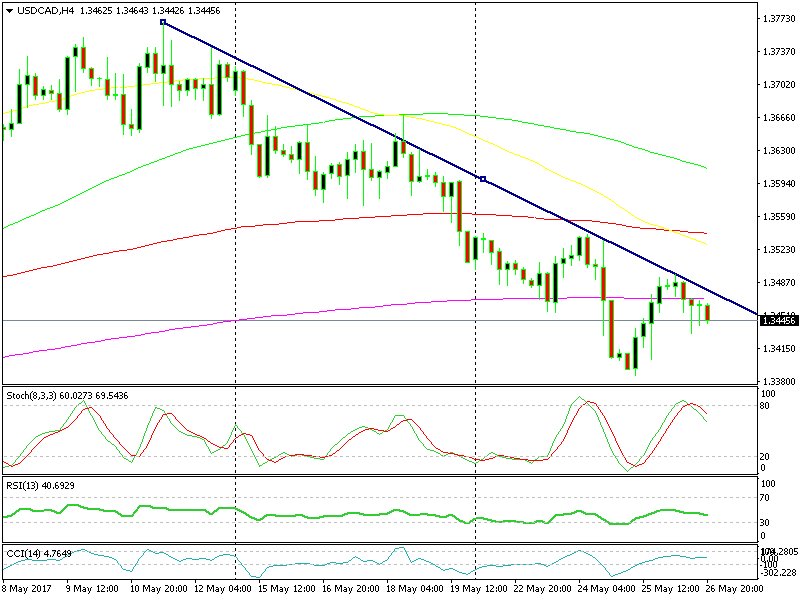
The downtrend is very clear
Also, if you look at the daily chart, the 50 SMA (yellow) came around the same levels as the ascending trendline of the H4 chart. This added extra strength to that resistance area and the next leg of the downtrend resumed.
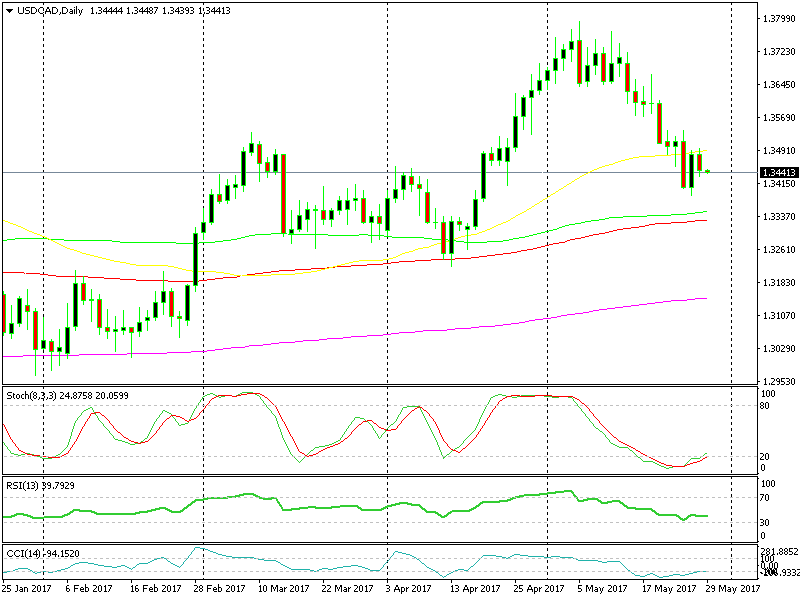
The 50 SMA has turned into resistance now
But actually, the daily chart shows that the larger trend is down. That makes this more of a retrace of the larger uptrend, which will soon come to an end. The question is where the end of this retrace is likely to be.
There are two potential levels; the first comes around 1.3340-50 where the 50 SMA and 100 SMA (green) stand on the H4 chart; the second level comes at 1.3270 where we can find the same moving averages on the weekly chart.
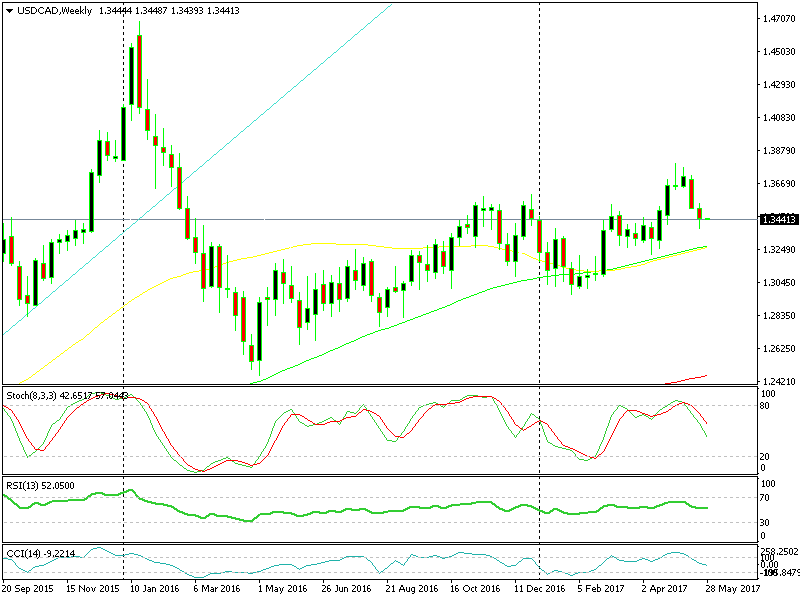
The two moving averages are catching up
The weekly chart are more reliable, since this is where the bigger uptrend is based. If we stick to this timeframe chart, the pullback lower has a little more room to run, until we reach those two moving averages. By that time, the stochastic indicator will be oversold as well, so logically that should be the end of it.
But the forex market often doesn’t care for logic, so when the price reaches the 100 SMA on the daily forex chart at 1.3350 we will keep an eye on oil prices, as well as on the USD's situation. If the USD is steady and oil prices show signs of weakness, the sellers might decide to call it a day right there. We´re 100 pips higher now and we might get down there by Tuesday, so watch out for a long term buy forex signal on this pair.