It’s Not a Safe-haven Flight, It’s Only the Yen


I was looking at the USD/JPY chart and saw that this pair was around 60 pips lower from top to bottom today. I thought that this could be a run for safe-havens, but then I saw that the CHF was down against the USD and Gold has lost around $4 this morning.
So, it is not a run for safety into the safe-havens, it is growing demand for the Japanese Yen. One of the reasons for this move is the softening of equities. European equities have been a bit soft in the last two sessions while Nikkei225 has lost 2,000 pips this morning.
The Bank of Japan sounded a tad more hawkish last week, which is the first time in a long time that this happens. They said last week that they could afford to let 10 year Japanese Government bond yields to rise up to 0.2%. This is another reason for the strength in the JPY since late last week.
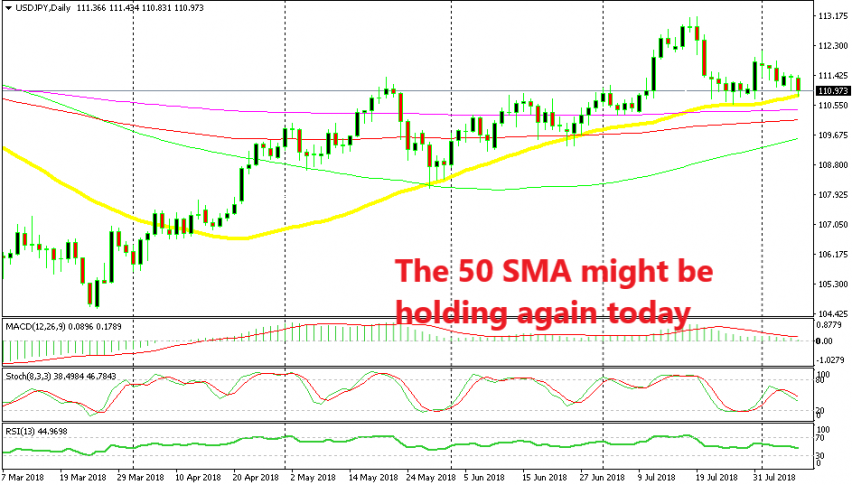
Looking at the daily USD/JPY chart, we can see that this pair started turning bearish by mid-July. But, the 50 SMA (yellow) held the decline and USD/JPY buyers had another try by the end of the month. Now, we are back at this moving average.
It looks like the 50 SMA is holding once again. The price just touched it for a moment when it slipped to 110.83 earlier this morning but it pulled back higher. Although, the price is still trading pretty close to the 50 SMA, it remains to be seen whether the sellers will break below it and win or if they will fail to break it which will make buyers the winners.