Looking to Sell EUR/USD After the Bounce off the 100 SMA Fades


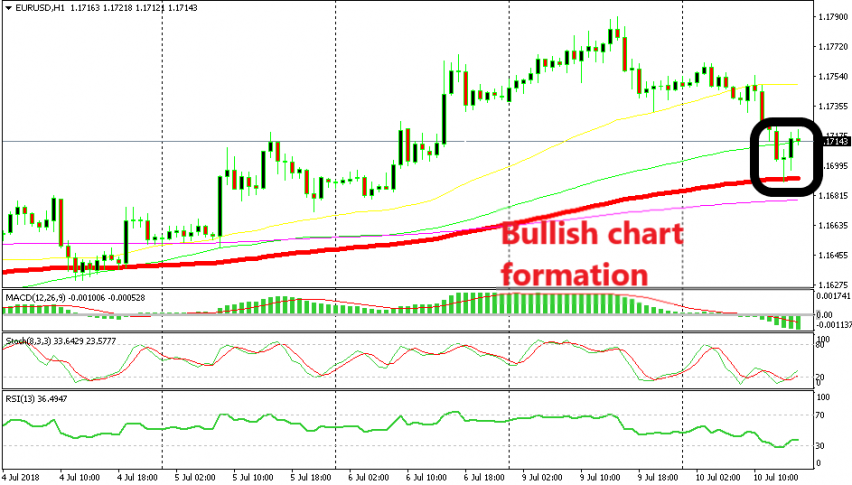
As a result, EUR/USD extended the decline in the European session. But, it reached a certain level where the sellers decided to call it a day and close their trades. That level was 1.1690, which doesn’t really hold much importance by itself.
But, the 100 SMA (red) is standing right there and this moving average has provided support before. It appears that the sellers saw the chart history and decided to close their trades, for now. The previous hourly candlestick closed as a doji which is a reversing signal. So, that indicator also played a role in the latest turnaround.
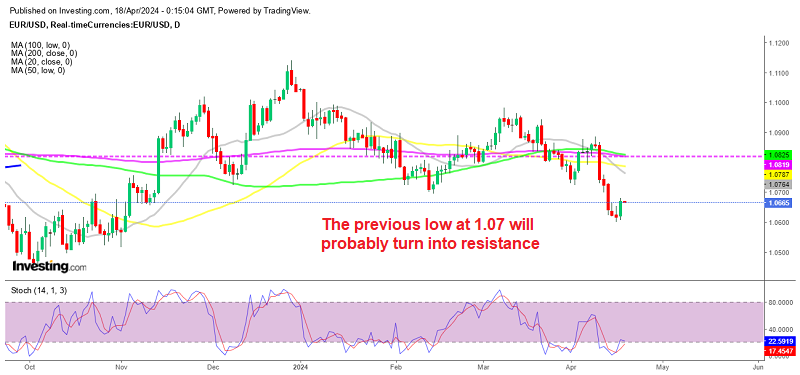
Now, EUR/USD is around 30 pips higher, but I don’t see this as a bullish move. Looking at the daily chart below, you can see that yesterday the price formed an upside down hammer. That is a reversing signal after an uptrend.
.png)
The upside down hammer points down in the daily EUR/USD chart
Today’s candlestick looks pretty bearish as well, which reinforces the bearish turnaround in this pair. Besides, the stochastic indicator is overbought and turning down now, so the bullish move is complete and EUR/USD is now entering a bearish phase.
With this chart setup in mind, I will wait for the latest bounce to be over on the H1 chart and then will look to open a sell trade. Perhaps, the 50 SMA would be a great place to sell, but only if the buyers manage to push that far.