

Indices made a bullish turnaround a couple of weeks ago after making a decent retrace lower in the previous two weeks. Since then, indices have been on a bullish run and Nikkei has been leading the way up.
The bigger trend is bullish as well if you check the daily or the weekly chart, so we are on the right side. But, we are trading with short term signals now so we have to concentrate on the smaller time-frame charts.
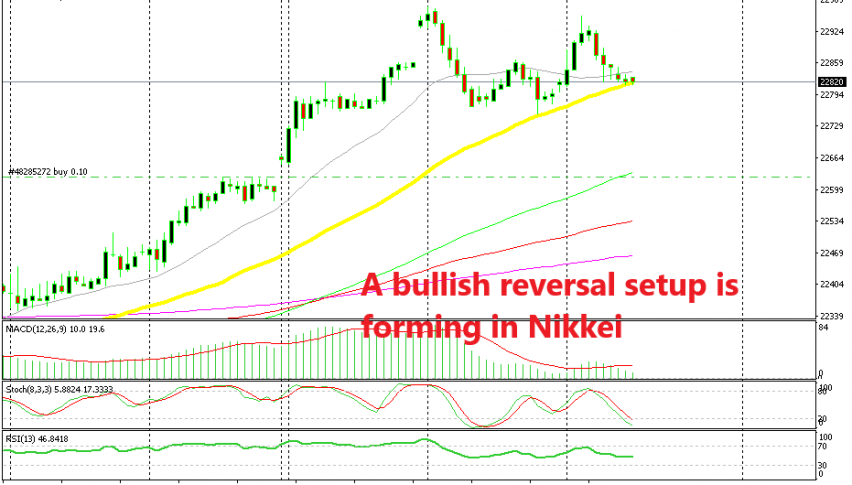
The hourly chart is pretty bullish as well, as you can see from the image above. The trend has been defined by the 20 SMA (grey) in the last several days, although this moving average was broken today as Nikkei and other indices completed a retrace lower.
I say completed because it seems like the retrace is complete on this timeframe chart now. The stochastic indicator is oversold which means that the H1 chart is oversold. When that happens during an uptrend, it means that the retrace is complete.
Besides that, we have another moving average providing support here. The 20 SMA might have been broken but the 50 SMA remains strong and it is providing support to Nikkei right now. We decided to go long right above this moving average a few minutes ago since the chart setup is pointing to a bullish reversal. The previous candlestick closed as a doji which is a reversing signal after the pullback so everything is pointing up. Let’s give it some time and room to play in hope that we will get another good round of pips today.