May 14 – Economic Events Outlook – Dollar On Backfoot As Treasury Yield Slips


Welcome back, traders. I hope you had a great weekend and are ready to trade.
As expected, the dollar opened lower in the Asian session, in response to sinking U.S. yields. Investors reversed expectations that the U.S. Federal Reserve will launch a series of rate hikes this year.
Speaking about fundamentals, the economic calendar is offering many trade options. On Monday, the volatility often remains low in the absence of major catalysts and I’m expecting the same today. However, we have the speeches from central bank officials to trade.
Watchlist – Key Economic Events Today
U.S. Dollar – USD
FOMC Member Mester is due to speak at the Central Banking Series hosted jointly by the Global Interdependence Center and the Bank of France, in Paris at 6:45 (GMT). The odds of fluctuations remain high as Mester is expected to respond to audience questions.
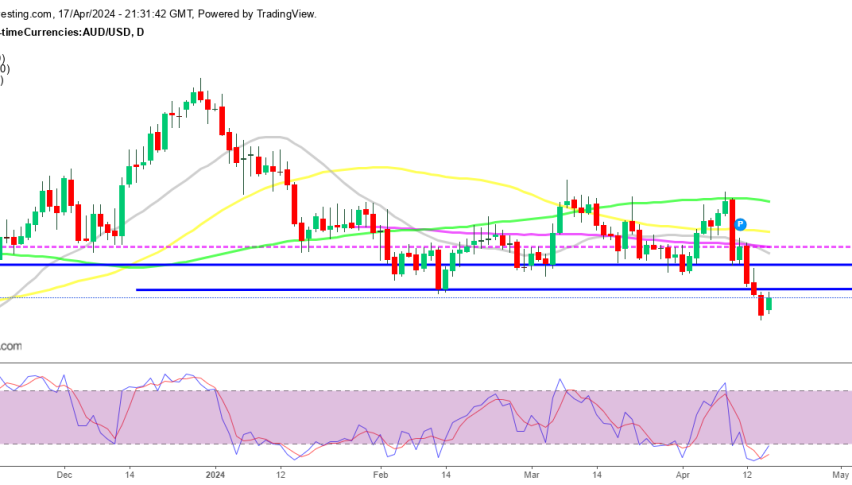
Australian Dollar – AUD
Similarly, RBA Assist Governor Debelle is scheduled to deliver a speech titled “The Outlook for the Australian Economy” at the Chief Financial Officers Forum, in Sydney at 23:10 (GMT). It’s likely to have a muted impact on the market.
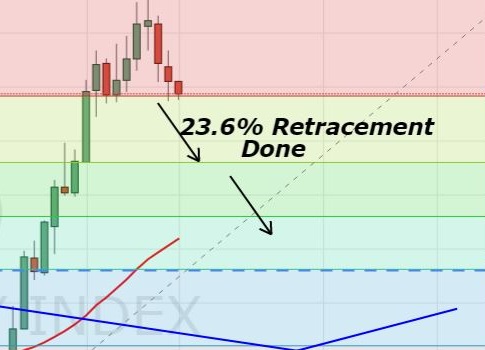
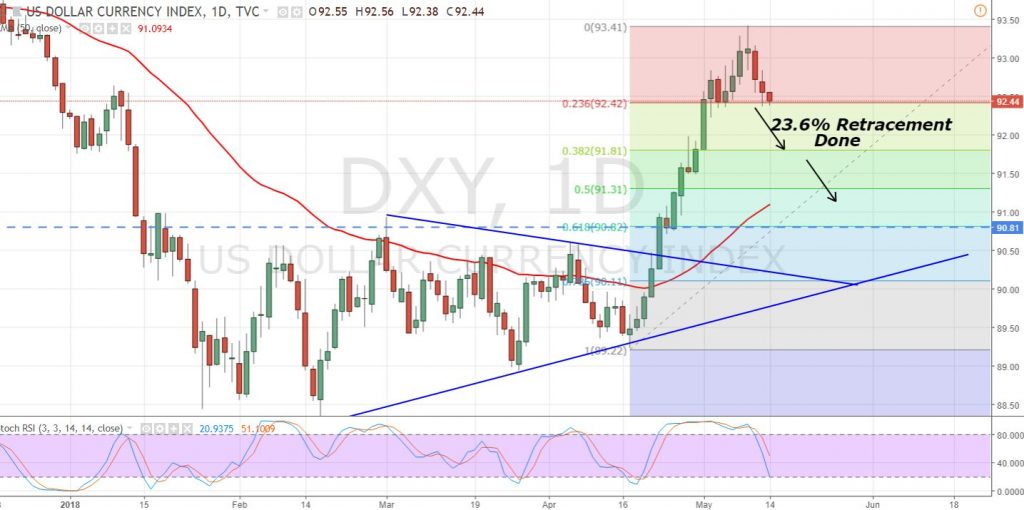
Dollar Index – DXY – Technical Outlook
The greenback is playing defense due to the worse than expected inflation figures as well as a drop in the Treasury bond yields. The dollar was also massively overbought and traders were looking for a reason to initiate profit taking. Looking at the daily chart, you can see all this begin on May 9 when the dollar index closed a doji candle. This is a neutral pattern. Yet, when it’s followed by a strong bullish momentum, it can work as a trend breaker.
The dollar index has already completed 23.6% Fibonacci retracement at $92.42. Any violation of this level is likely to add bears until $91.81 (38.2% Fibo level) and $91.31 (50% Fibo level).
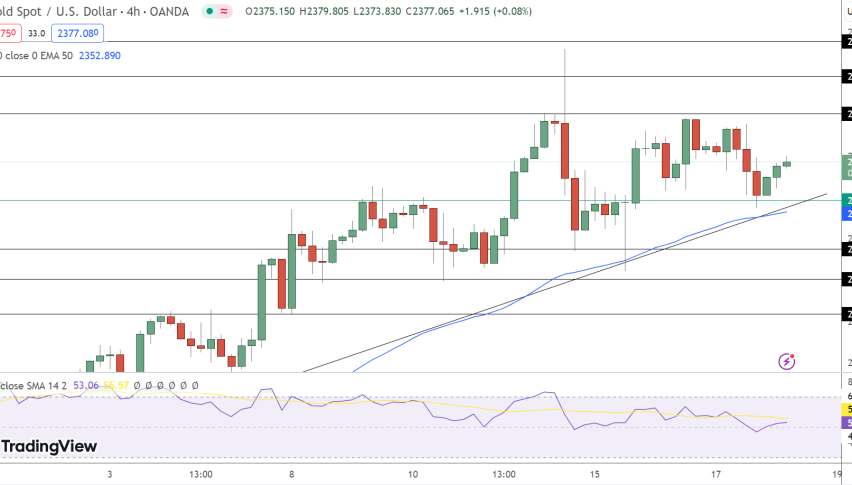
Gold – Daily Chart
DXY is likely to trade in a narrow range of $92.45 – $93.40 if it fails to break below $92.45 today. Check out FX Leaders report on Weekly Economic Outlook to plan your trading week. Good luck and trade with care!