Nikkei Is Testing The 50 EMA – Is It A Sell Signal?


The Japanese stock market index, the Nikkei, recovered from earlier losses after the release of favorable GDP (Gross Domestic Product) from the United States. However, earlier this morning, the Nikkei traded exactly as we predicted in our previous update named Another Gap in Nikkei – Is it Time To Buy or Sell?
 Nikkei – Hourly Chart
 Nikkei – Hourly Chart
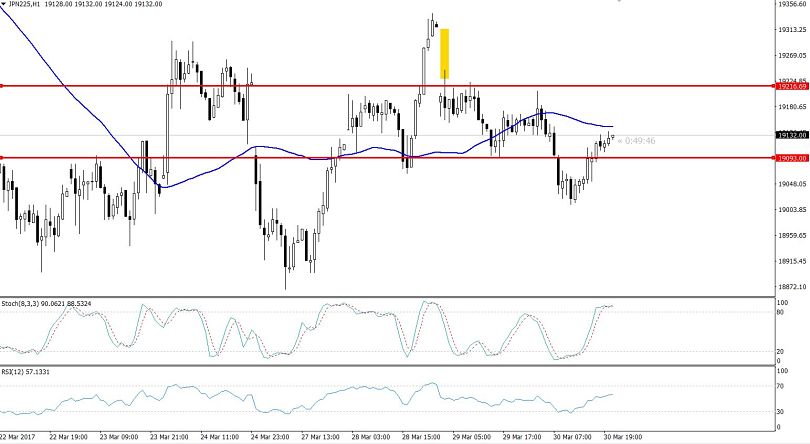
At this moment, the Nikkei is trading at $19132 after placing a low of $19013 in the European trading session. I want to highlight the shift in the trading sentiment. The market is now trading with a bullish sentiment. The Nikkei has soared more than 115 pips alone in the New York session. Thus, on the daily chart, it’s likely to form a spinning top candlestick pattern by the end of this session, which demonstrates that sellers are exhausted and we may see more buyers entering the market.
For this reason, even if the market is testing the 50 periods EMA along with the RSI which is indicating a bearish bias in the hourly chart, it’s better not to enter a sell position. I am also cautious about the big gap on the hourly chart. The Nikkei may try to fill this gap soon at $19315.