Pound Rises Sharply, Dollar and Nikkei Fall


“Just be careful of some kind of wild card which could emerge from Theresa May’s speech tomorrow. You never know what will happen in the FX market, neither do you want to get caught up on the wrong side of a powerful short squeeze. We should never be off guard in this game!”
Hello, traders! I hope those of you who read this in yesterday’s trading plan took heed to it, as this is exactly what happened today.
The UK Prime Minister Theresa May made a formal announcement today, that the UK government will seek parliamentary approval to trigger Article 50 which is the legal mechanism by which the UK could depart from the European Union. This changes the Brexit ballgame considerably and suggests that it may be much softer than it has recently been anticipated. This caused a massive bid in the British Pound today. The GBP/USD gained an incredible 357 pips and the GBP/JPY about 250 pips. Of course, these were not the only Pound pairs which were positively affected (negative for the EUR/GBP, of course). This great Pound strength was felt right across the board in the FX market. Not all of these Pound gains can be ascribed to Theresa May’s speech today, however, as the UK CPI numbers beat expectations which also added to the bid in the Pound. Before I say too much, let’s jump to the charts:
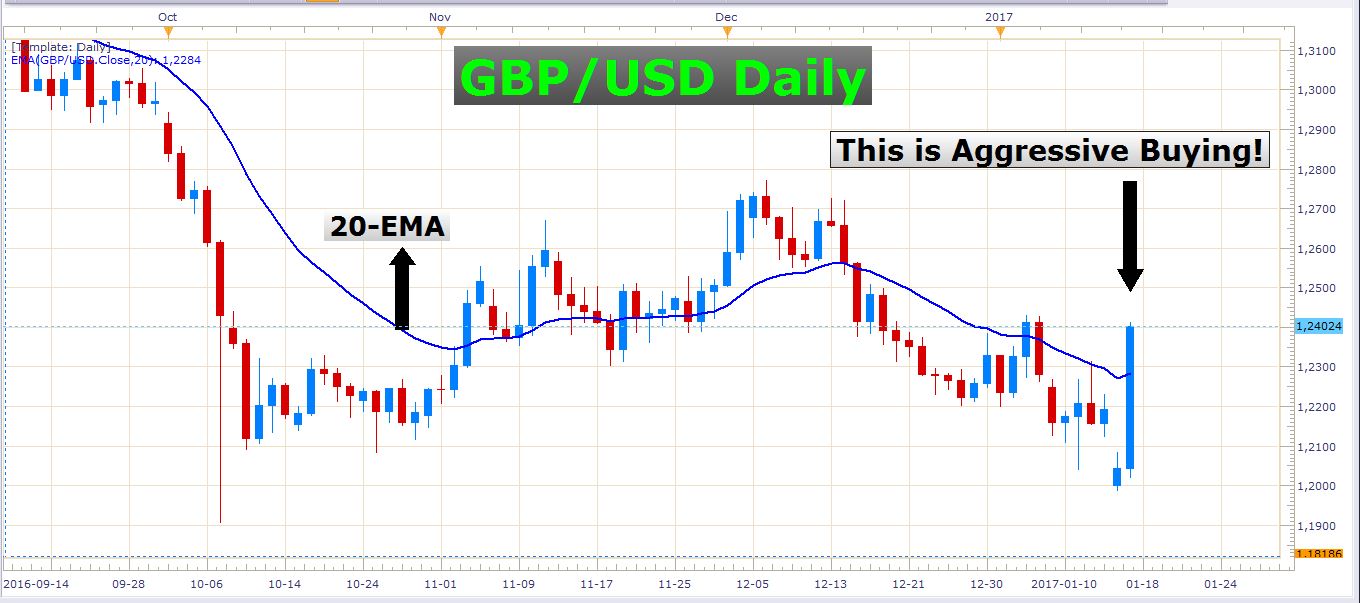 GBP/USD Daily Chart
Wow! When was the last time we saw such a large bullish candle on the GBP/USD? This is definitely not your average daily candle on this pair.
I didn’t actually follow May’s speech today, but I certainly traded the price action that resulted from it. Of course, I bought into this Pound strength and made a handsome profit in doing so. You see, trading is all about observation, and it is often not too hard to spot strong impulsive moves and to put some money behind it. I knew there was a strong catalyst in the form of May’s speech, so when I saw the impulsive price action which took off like a rocket, I knew I had to play this move. Look at this 5-minute chart of the GBP/USD:
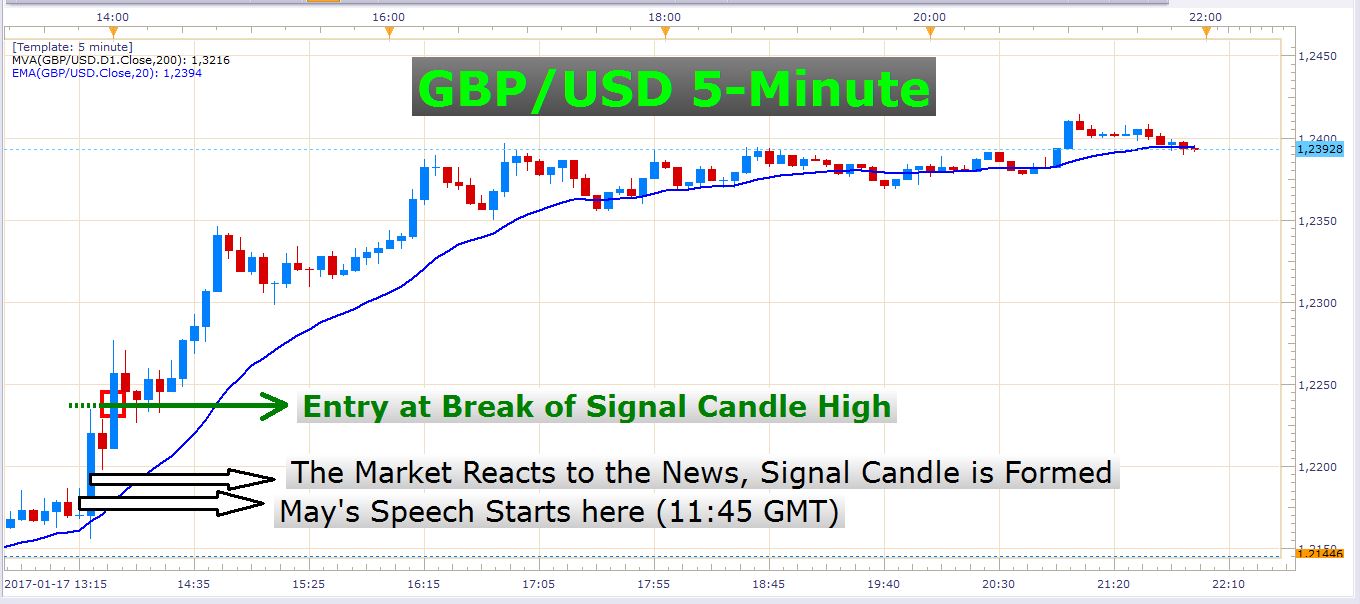 GBP/USD 5-Minute Chart
It is sometimes wise to trade a breakout like I indicated on this chart. The signal candle’s range is about 79 pips, which is a very large movement for a 5-minute candle. The price then retraced about 37 pips before it continued on its bullish course. This continuation move was a great opportunity to enter long on a breach of the signal candle’s high.
If you missed this opportunity, don’t fret about it, because there will always be some more big moves to trade along the way. Let’s look at some other instruments…
USD/JPY – Severely Wounded
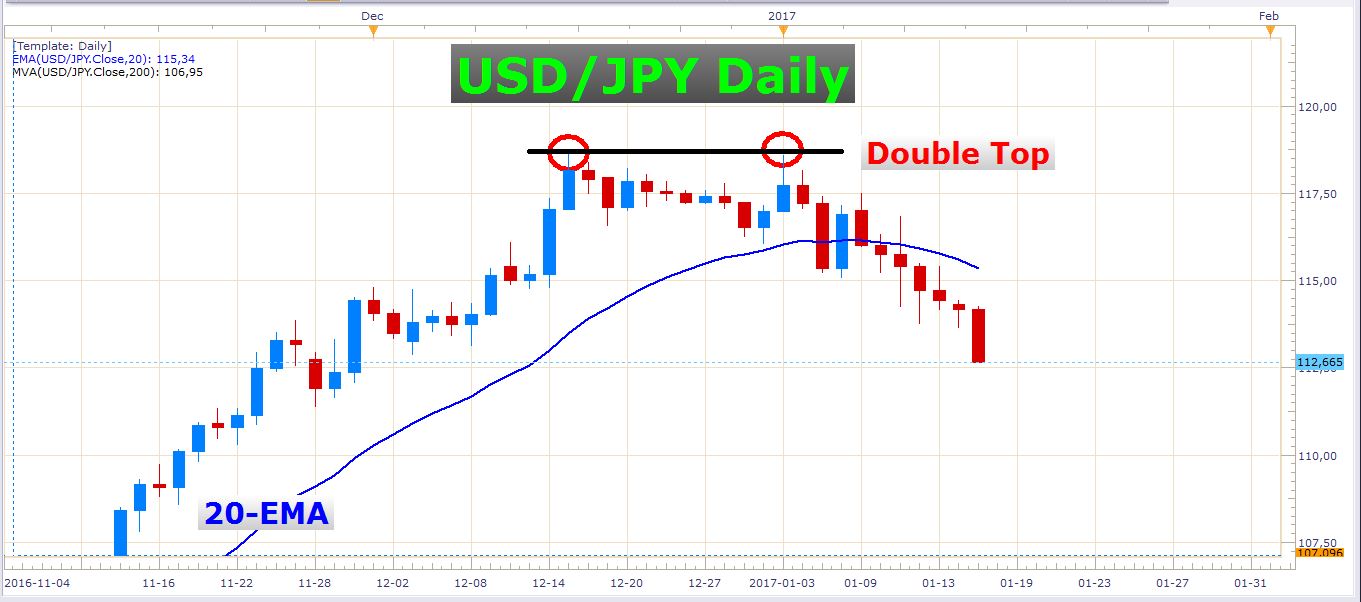 USD/JPY Daily Chart
This is also a pair I traded today, but on the short-side, of course. Since the pair formed a double top a couple of days ago, it has been declining aggressively. In my opinion, this pair holds massive potential for short trades in the days and weeks ahead. The US Dollar declined against all the other major currencies today, and this decline has actually been quite impulsive. We don’t have time to look at all the major pairs tonight, so let’s quickly look at the US Dollar index:
US Dollar Index – The Buck is Running Out of Steam
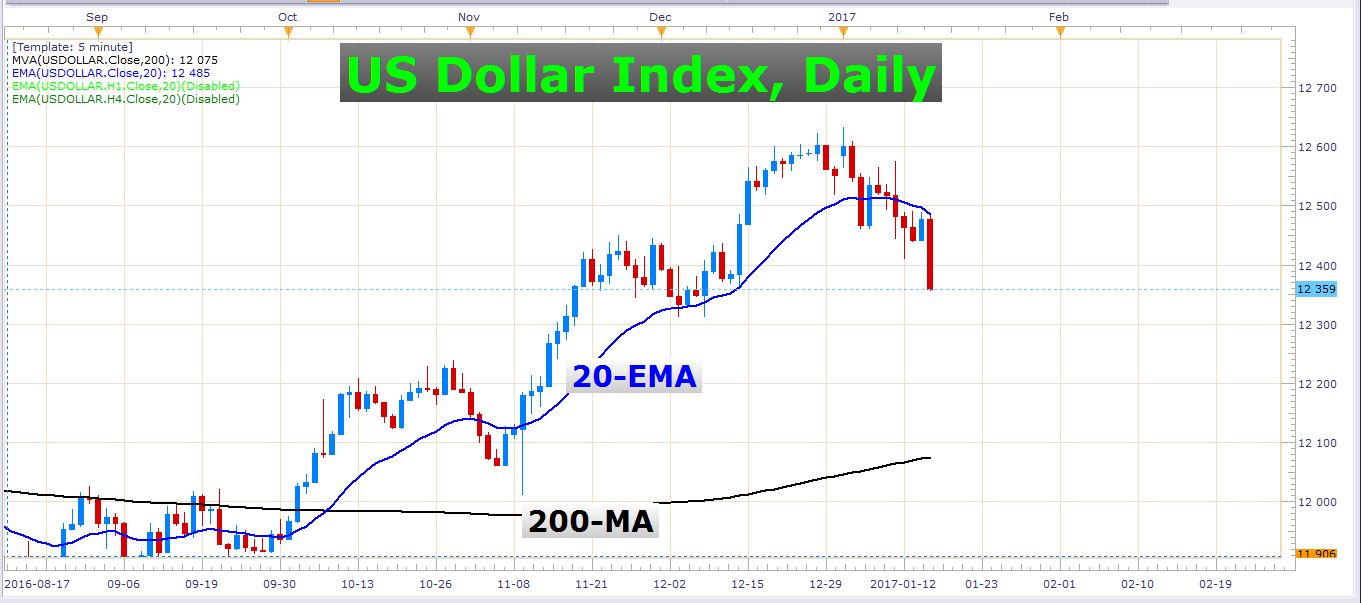 US Dollar Index Daily Chart
This is a solid sell-off. Of course, the GBP/USD’s massive rise today has magnified the losses on this index because the Pound makes out 25% of it. Nevertheless, the other currencies which constitute the remaining 75% of this index have all performed really well against the Dollar today. They are the Australian Dollar, Euro, and Japanese Yen. I would be very careful to buy the US Dollar at this stage, as I don’t want to fight an impulsive selloff like this.
Nikkei 225 – Turning Bearish
The Nikkei is starting to look really bearish and is strongly continuing to diverge from the S&P 500. Look at this daily chart:
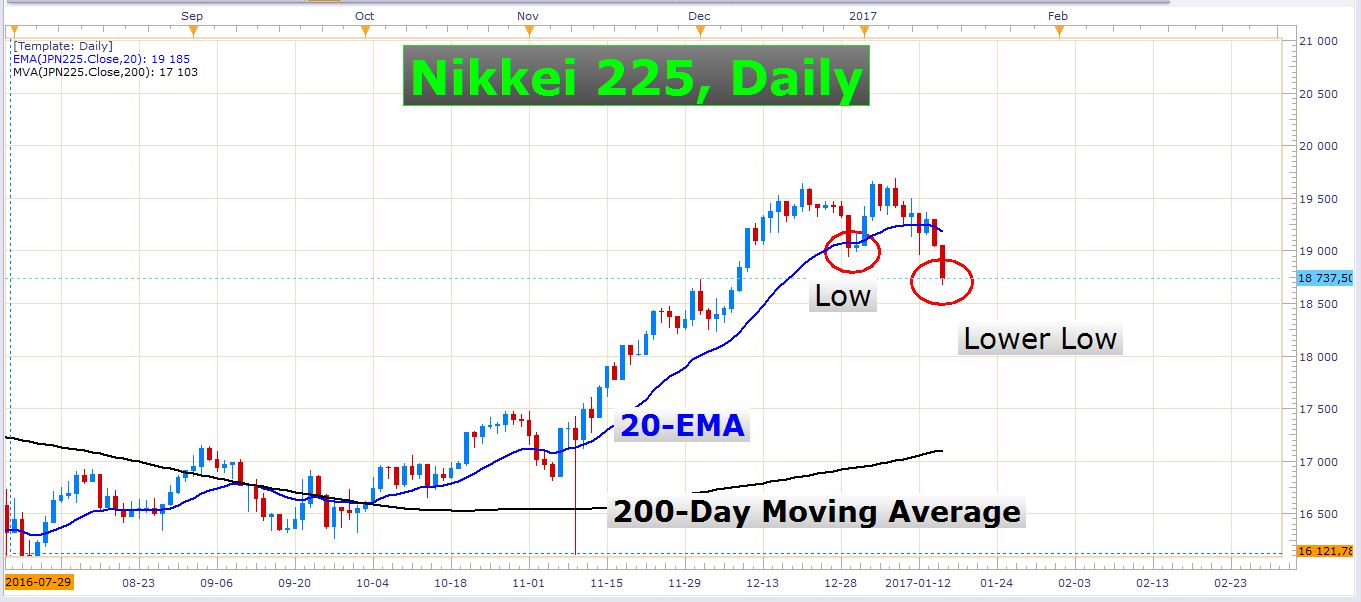 Nikkei 225 Daily Chart
Just a reminder, the Nikkei is a Japanese stock index.
This chart clearly displays weakness in this instrument. It looks like there might be some good selling opportunities in the next few days, especially if we get a reasonable retracement to fine-tune a short entry. I would be more comfortable with an entry closer to the 20-day exponential moving average, but to be realistic, we might have to use smaller timeframes to look for pullbacks like the 4-hour chart for example. Of course, there are other ways to trade this instrument, like for instance trading a breakout of some sort. The technique you use should be suited to the market structure and timeframes you use.
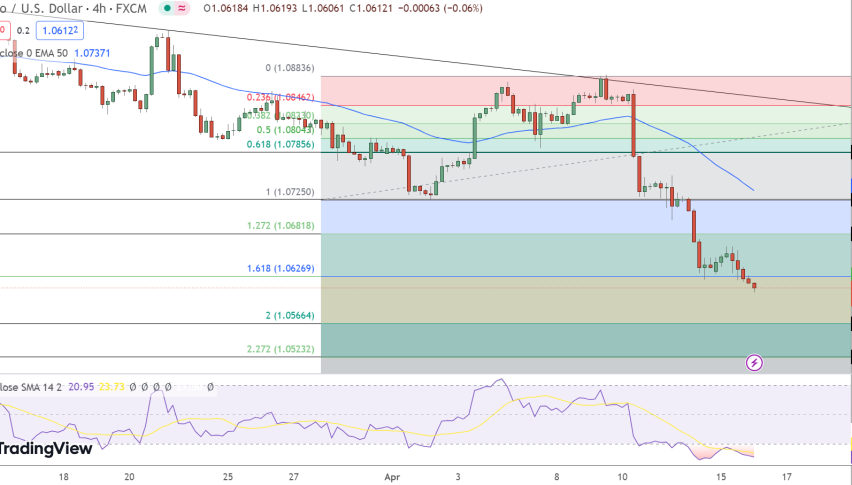
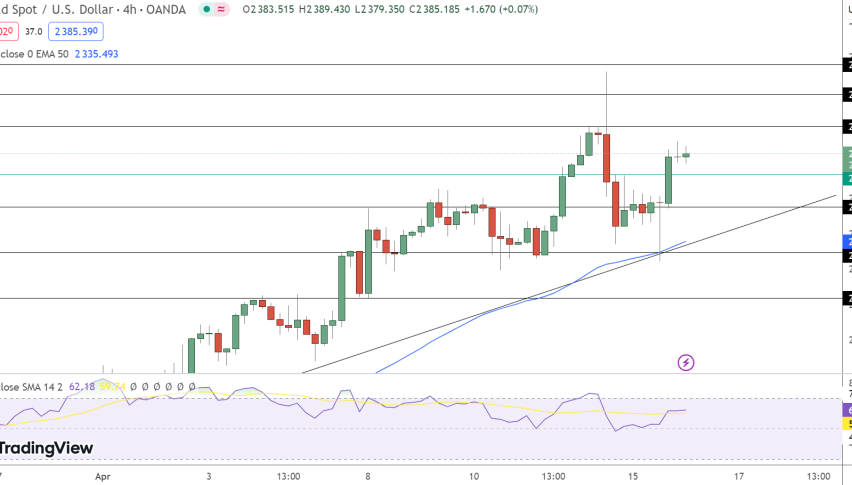
Gold
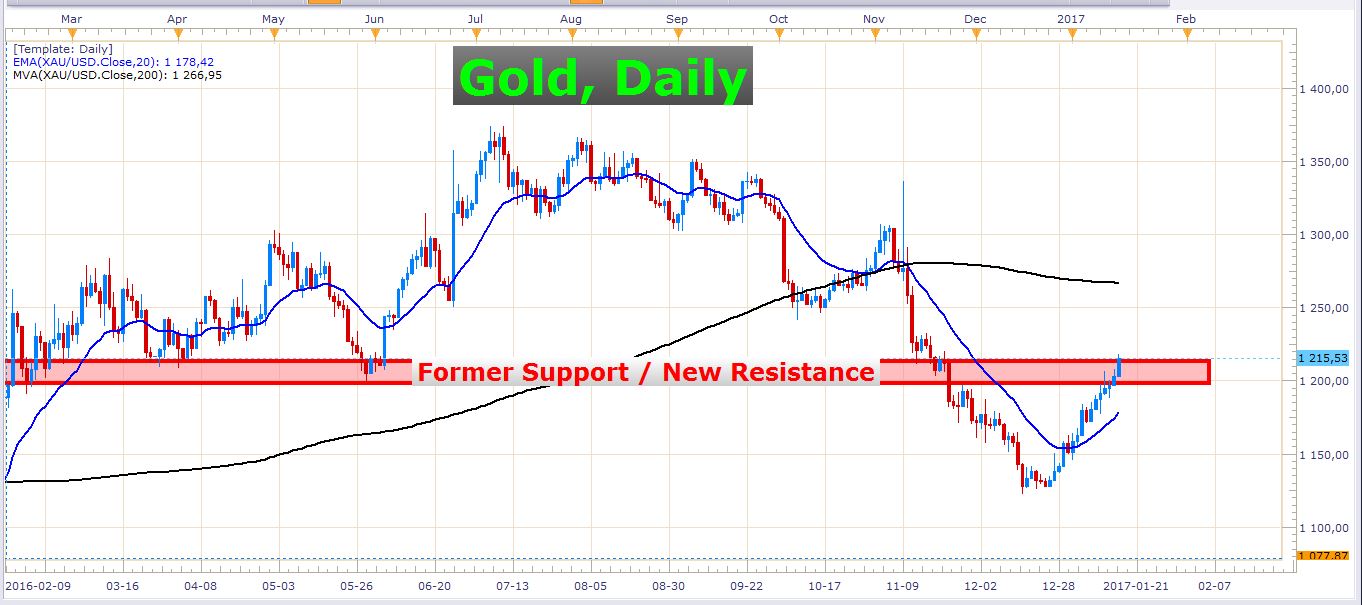 Gold Daily Chart
Just a quick note on gold – the price of this commodity has continued to rise over the last few days. It doesn’t look like it is respecting the former support zone as new resistance. We haven’t encountered a solid sell signal yet, so for now, we don’t have enough conviction for a short play. The weak Dollar has contributed to have pushed this price higher. Let’s see what happens to the price in the next few days.
That’s all for tonight folks, my eyelids are getting heavier by the minute – it’s almost midnight here in South Africa.
Best of luck with your trading!