

While safe-haven currencies have found decent bids in recent weeks, Gold (XAU) hasn’t benefited from this. In fact, Gold has gone totally in the opposite direction. It started turning bearish since mid-April and the bearish trend picked up pace in the last month or so.
I have heard many reasons for this strong bearish trend in Gold, but for me, this is purely technical, or the biggest reason is technical. Gold was overbought in April and it was finding it really difficult to break the 100 SMA on the monthly chart. So, it turned bearish after failing to break the 100 SMA and it has been sliding since then.
Although, we are in a short-term trade here so we will take a look at short-term charts. We opened a sell forex signal in Gold a while ago and we had several reasons to do so. The main reason is that Gold has been bearish on long-term charts, so we’re just going with the trend here.
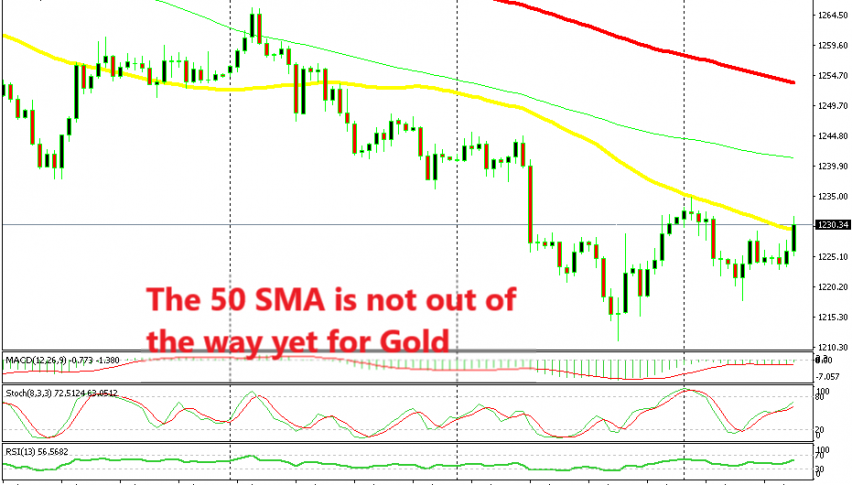
The H4 Chart
Gold has retraced higher in the last few days though. The USD index has turned lower and as a result, Gold has benefited from a weaker Dollar. Well, gold couldn’t take advantage of the demand for safe-havens, so at least it is benefiting from the USD weakness of the last few days, since Gold is traded in Dollars.
As you can see from the H4 chart above, Gold has retraced higher and at the moment it is trading around the 50 SMA (yellow). The 50 SMA has been pierced, but it doesn’t count as a break until the current H4 candlestick closes above it. At the moment, Gold is slipping lower, so I think that the current candlestick will close below the 50 SMA.
The stochastic indicator is approaching the oversold area pretty fast and considering the last bullish candlestick, it will become oversold when the candlestick closes. This will mean that Gold will be overbought soon on the H4 chart.
The H1 Chart
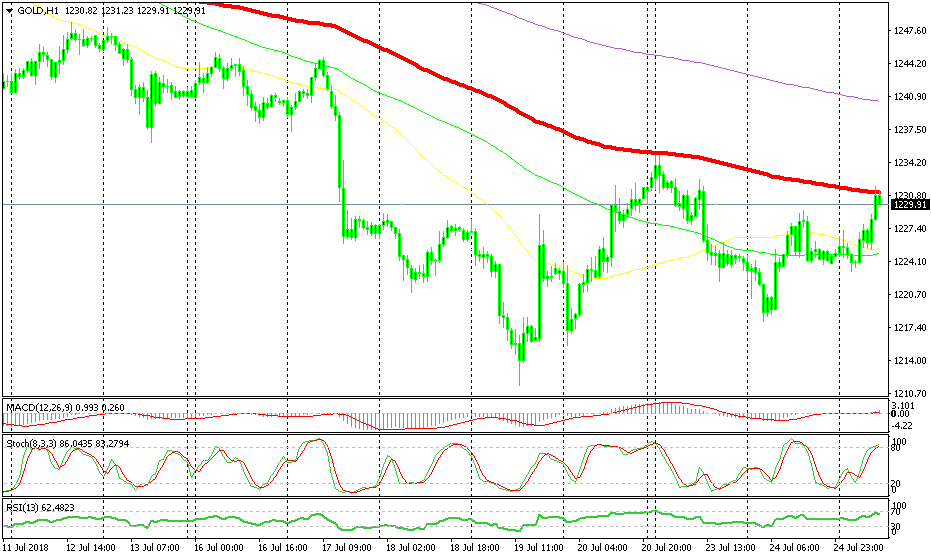
The setup on the H1 chart points to a bearish reversal
Besides that, if you switch to the H1 chart, you can see that the 100 SMA (red) is also providing strong resistance for Gold. It reversed the price lower on Monday morning and the buyers are finding it hard to push above this moving average.
The stochastic indicator is obviously oversold and turning lower now, which is another bearish signal. So, all technical indicators are pointing to a bearish reversal, which would bring Gold back to the long-term bearish trend. If you are thinking about trading Gold, then make sure to place the stop above the 100 SMA.