Support and Resistance Levels for Bitcoin


Bitcoin has been on a steep downtrend this year as the crypto market continues to slide after last year’s crazy surge. Although, in the last several days, the downtrend has stopped and we have seen a retrace up take place.
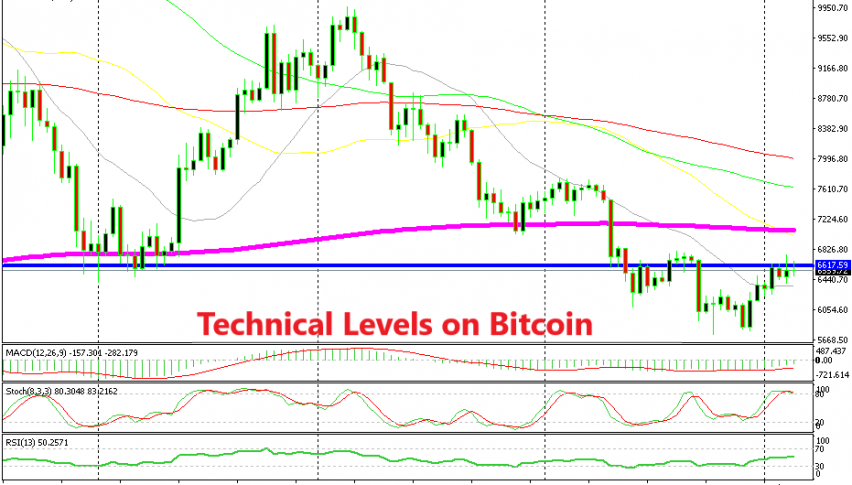
The previous low was broken in Bitcoin, but the price moved back up above it. As a result, Bitcoin has formed some support levels nearby as well as some resistance levels above. Let’s have a log at these levels.
Support | Resistance |
$6,360 – 20 SMA (grey) | $6,700 – The High This Week |
$6,000 – Previous low | $7,000 – 200 SMA (Purple) |
$5,750 – Current Low | $7,650 – 100 SMA (green) |
$5,000 – Big Round Level | $8,000 – 50 SMA on Weekly |
The retrace up looks complete since the stochastic indicator is overbought on the daily chart. If you planning to sell, then you should use the resistance levels as entry points and the support levels to look for a way out. If you are buying, then watch the price action at the resistance levels. If Bitcoin acts weird, then it might be time to get out before a bearish turnaround, if you have bought in the previous days. keep in mind that these are rough levels since the volatility is elevated in cryptocurrencies and not all brokers have the exact same prices.