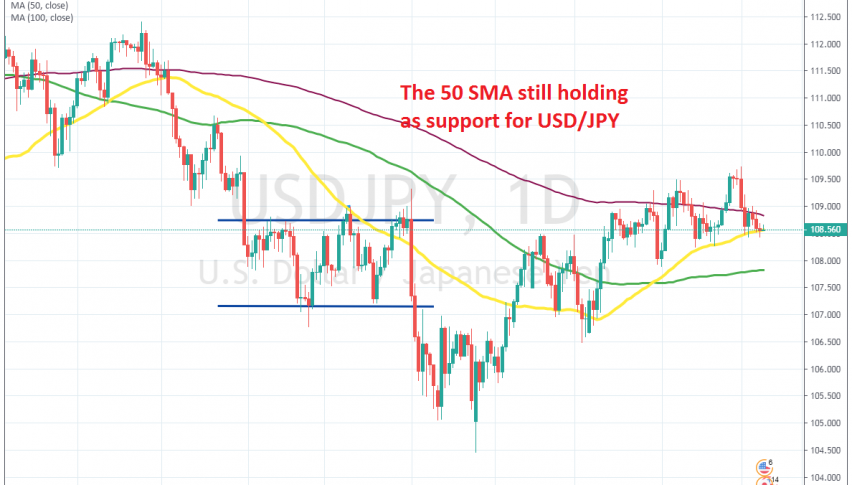
The 50 SMA Continues to Hold for USD/JPY on the Daily Chart


USD/JPY used to be pretty bearish during summer, as the trade war escalated and geopolitical tensions increased during that period. But, in September the sentiment improved after the tensions de-escalated and in October, the partial trade deal comments helped it further.
USD/JPY reversed higher and it has been on a bullish trend since then. Moving averages turned from resistance into support, particularly the 50 SMA (yellow) on the daily chart. That moving average turned immediately into support in September, after USD/JPY turned bullish.
It was pierced briefly in October, but the price returned above it again and since then, this moving average has been providing support several times, reversing USD/JPY higher and pushing the uptrend further. Last week, we saw the price bounce off the 50 SMA for the last time.
But USD/JPY couldn’t push above the 200 SMA (purple) and the price returned back down. The 50 SMA was pierced again yesterday, but the price surfaced back above it, so the 50 SMA is still doing a good job as support and it should be seen as a good place to go long from.