The 50 SMA Is Working Well for Bitcoin. Go Long?


Yesterday, in one of the forex updates, I highlighted a possible trade idea in cryptocurrencies, particularly in Bitcoin, since the chart setup was really favourable for buyers.
Digital currencies have slipped lower in the past couple of days, which looked like a pullback before the next move up.
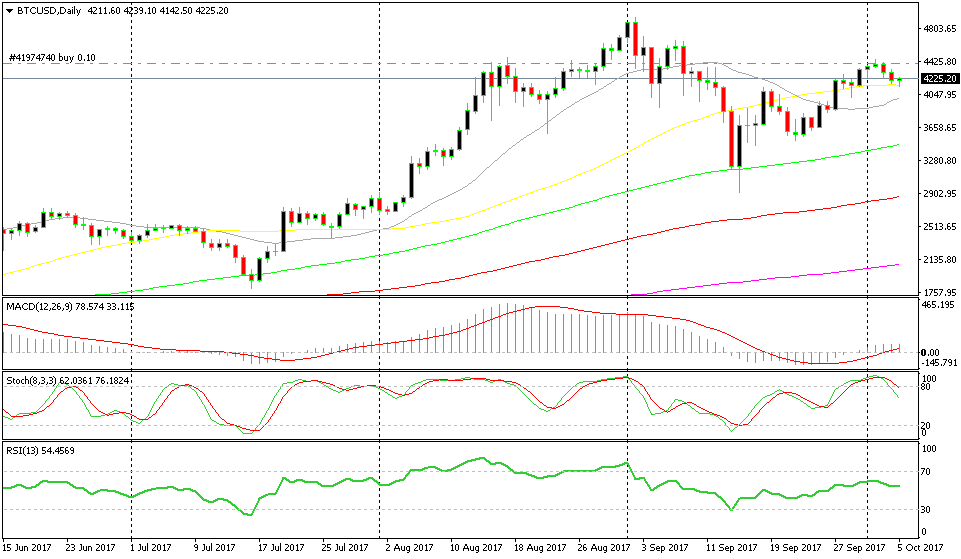 Looks like the 50 SMA is holding
Looking at the daily chart, the climb higher since the mid-September has been a loot steeper than the retrace of the last two days. This shows that the pressure is on the upside, while pullbacks are seen as buying opportunities.
The indicator I was looking at to go long from was the 50 SMA (yellow) on the daily Bitcoin chart. It has provided support and resistance before so it was going to provide some support this time as well.
Today, the price slipped to kiss the 50 SMA briefly, and then it turned higher. Now the price is around $100 higher and the daily candlestick is closing as a pin, which is a reversing signal after the short-term downtrend.
The day is still young but if the candlestick closes like this then this would be a great opportunity to go long. Although, I would like to see the price close to the 50 SMA again so the risk/reward ratio is better.