The Perfect Selling Opportunity in Gold


Gold has been trading on a downtrend which started back in April. Gold buyers failed to break above the 100 SMA on the monthly chart and the stochastic indicator was overbought on that time frame and after that the downtrend began.
It has been pretty strong and straightforward for the sellers. The major levels which were supposed to provide some decent support proved to be nothing more than small bumps on the road. There have been retraces higher but they have been pretty minimal and the sellers have returned, pushing the price further below making new lows.
Since the trend took form properly, the 200 SMA (grey) has been the one to provide support and define the downtrend, apart from one occasion back in June. It has been a great indicator and whoever has traded Gold against it during this time should have made plenty of pips. My colleague Arslan takes cares of commodities signals and trade analysis which includes Gold as well, but I opened a sell signal about a month ago against the 20 SMA and it went like clockwork.
So, retraces to the 20 SMA have proved to be great selling opportunities. In the last few days, Gold has retraced higher after it formed a doji candlestick last Thursday. Dojis are great technical indicators which signal reversals and, even in such a strong downtrend, it did a great job signalling a reverse last Thursday.
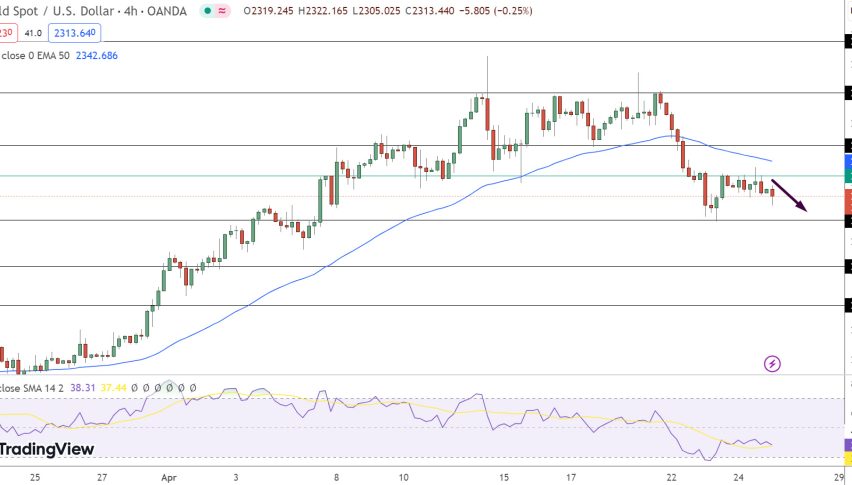
So, Gold has been retracing higher but it ran into the 20 SMA again yesterday. The 20 SMA rejected the price once again and the daily candlestick closed as a doji again, albeit smaller. Stochastic is now overbought so this is the perfect chart setup for sellers.
Indicators pointing to bearish a reversal
- Overbought stochastic
- Yesterday’s doji candlestick
- Strong downtrend
- 20 SMA providing resistance
As we know, things often don’t go according to plan in forex. But, this looks like a great opportunity to open a long term sell signal in Gold. The Dollar index USDX has been declining for several days so now it is time for a pullback at least, although we don’t know if it will happen, but the daily chart in Gold screams sell.