The View From 10,000 Feet: Weekly Technicals For Gold


For the last six weeks, the gold market has been chaotic. Whipsaw trading has been the daily norm featuring sporadic trend days to the bull and bear. In contrast to the run-up of late 2017, investors have been non-committal toward bullion for most of 2018. It seems that every attempt to drive this market lower or higher has been checked hard.
Today’s action on the gold futures markets has been hot. Volumes in April gold are already over 250,000 contracts traded, with participation being heavy near the 1330.0 handle. After Wednesday’s trend north, we are witnessing this market regain order.
Gold Weekly Technicals
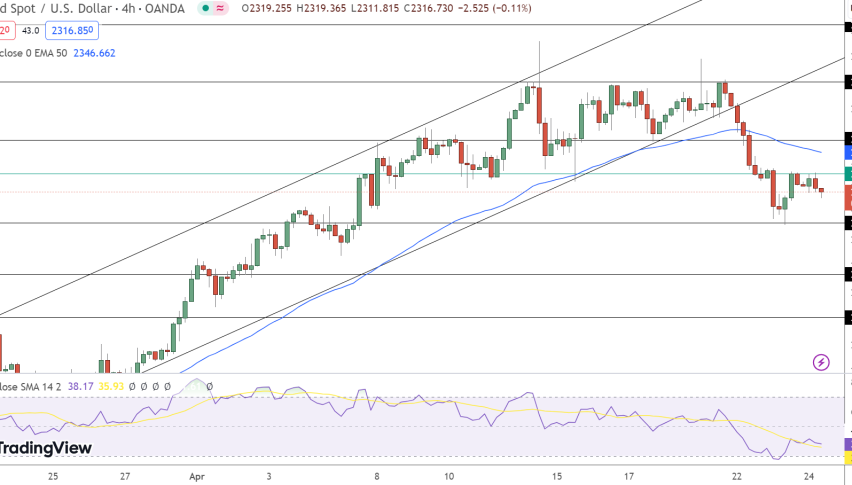
Getting bogged down in the intraday and daily price action of a commodity is easy to do. Every now and then it is a good exercise to take a look at the big picture. Below is the weekly chart for April gold futures.
++Week+50_2016+-+Week+12_2018.jpg)
The fierce rally of December 2017 and early January 2018 has put on the brakes. Here are the key technical observations facing the intermediate-term valuations of this market:
- Price is attracted to the 38% retracement level of the Dec./Jan. bull run, 1321.7. For the last seven weeks, this level has acted as support or an area of consolidation. The inability to sustain trade beneath this level promotes a bullish bias.
- April gold has not sustained trade beneath weekly downside support at the Bollinger MP or Weekly SMA. Every time price penetrates the Bollinger MP, it quickly rallies. Again, this is a bullish sign.
- The Support Area of 1321.7-1310.0 is consistently drawing long-term bids. The 1310.0 level is one to watch moving forward. Bulls have put their heels in the sand repeatedly at this level thus far in 2018.
Bottom Line: The weekly chart confirms my intermediate-term bullish bias toward gold. Until the bears enter the market in full-force, the December/January rally is still technically valid.
So, how do we trade it? That is the challenge. Simply put, I will be looking for long entries from the 1310.0 area on smaller time frames. As of this writing, price is a ways off, near 1330.0. If we see a break to the bear in coming weeks, then longs from the 1310.0 area provide premium trade location to the bull.