Three Indicators Point to A Reversal in NZD/USD


We just opened a sell forex signal in NZD/USD. There are a number of reasons for this trade, some of them technical and some of them fundamental. The fundamental reason is pretty clear; Donald Trump is imposing additional tariffs on Chinese products estimated to be worth around $100 billion and the Chinese are retaliating, which has turned the market sentiment negative. So, if you are trading fundamentals, then you should be short on NZD/USD, which is what we are doing right now.
3 Technical Indicators Look Bearish
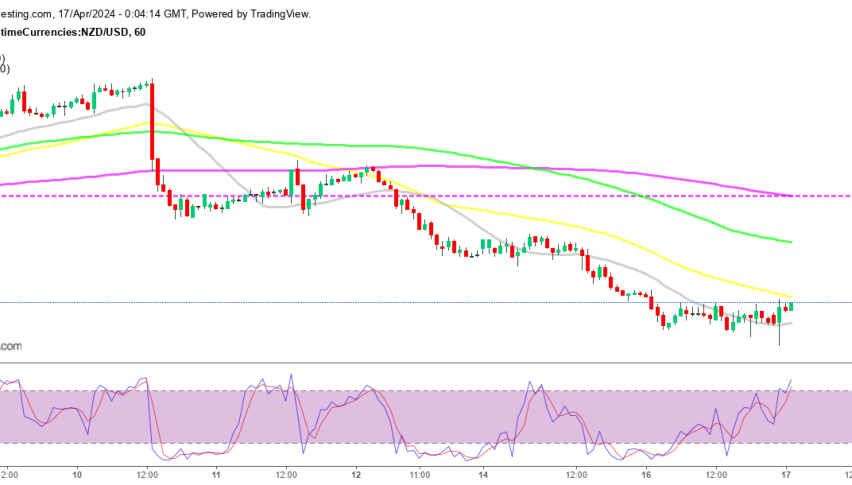
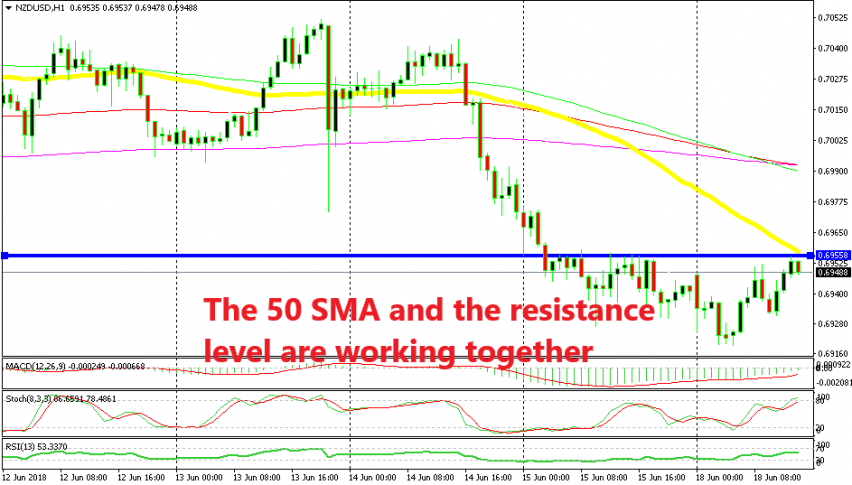
The fundamentals are pretty clear too. NZD/USD entered a strong bearish phrase on Thursday as the USD gained momentum. It traded sideways on Friday, consolidating below 0.6950-60 but it didn’t move above this area. So, we can conclude that the area around 0.6950-60 has turned into resistance. The horizontal line shows that pretty clearly.
Another technical indicator which is pointing down is the 50 SMA (yellow) on the H1 chart. Moving averages are really good support and resistance indicators, especially when they work together with other indicators such as the resistance level on this occasion.
The third indicator pointing south is the stochastic indicator. It is overbought now, which means that the retrace up is complete. You can see that the price moved down on Friday when stochastic became overbought. Stochastic is again overbought and now more indicators have joined in the bearish reversal chart setup. I think the reverse is beginning already.