Thursday Morning Levels – EUR/CHF Technical Analysis


We posted an update about an hour ago about the Swiss Franc and how the SNB (Swiss National Bank) is fighting back the forex market which is trying to push EUR/CHF down. That was more of a fundamental analysis since we analyzed the battle between major market forces, so I think we must take a technical look into this forex pair as well.
Looking at the H4 EUR/CHF chart, we can see that the 100 smooth moving average (100 SMA) in red is providing resistance on the top side at 1.0780. It has topped the moves twice since this forex pair failed to break above 1.08 yesterday and slipped back down. So that´s the first line of resistance, although it is pretty mild.
The closes decent resistance level is 1.0815-20 of course. It was the high yesterday and I saw some weakness up there, judging by the price action. Maybe that´s a level where the SNB unloads some of its EUR/CHF long positions, so that´s the second resistance level. The 50 SMA in the daily forex chart and the 200 MSA in the H4 chart, as you can see above, are waiting around there which give this level extra strength.
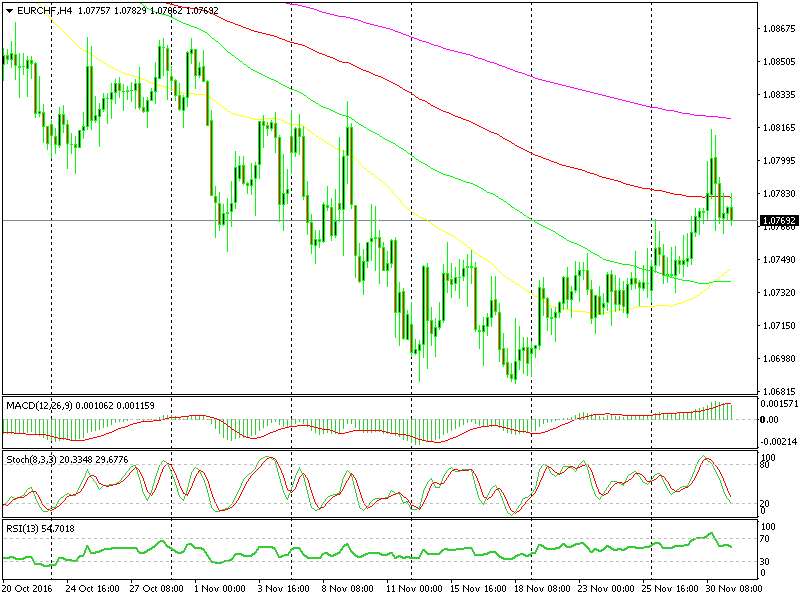 The moving averages have caught up with the price now
The 1.0860-70 is another resistance level on the top side, since it was a support level in April this year. On top of that, the 100 simple MA and the 100 Smooth MA are waiting up there. Above there comes the 1.0900-10 level where we can see the 50 SMA in the weekly forex chart and finally 1.0960, which has been a strong resistance all this year and where we can find the 200 SMA on the daily chart.
The price is heading up in this forex pair, so the resistance levels are important to spot possible exit points, but we also need entry points in case there is a retrace back down. So here are the closest EUR/CHF support levels for those who missed the northbound levels.
The closest support level comes at 1.0760, which has been the low since yesterday and where the 20 SMA stands on the H4 chart. The 1.0740-50 level was the top for a couple of weeks last month, so it will naturally provide some support on the way back down. 1.0720 is another prior resistance, but the support levels to consider below there are 1.07 and 1.0680s. These are the ultimate support levels and if they go, then a big bang is coming up whether it is a strong SNB intervention or a flash crash like the ones we have seen several times in the past two years.