USD/CAD Double Bottom – How to Trade Canadian Inflation Rate


It’s a fine day to trade the Loonie pairs as the Statistics Canada is due to release the CPI & Core CPI figures later today at 13:30 (GMT). Headline inflation grew by 0.5% in July, while Core CPI inched behind with a more modest 0.2%. The Bank of Canada needs to see a significant rise in inflation in order to justify a move. So, buckle up to trade the event…
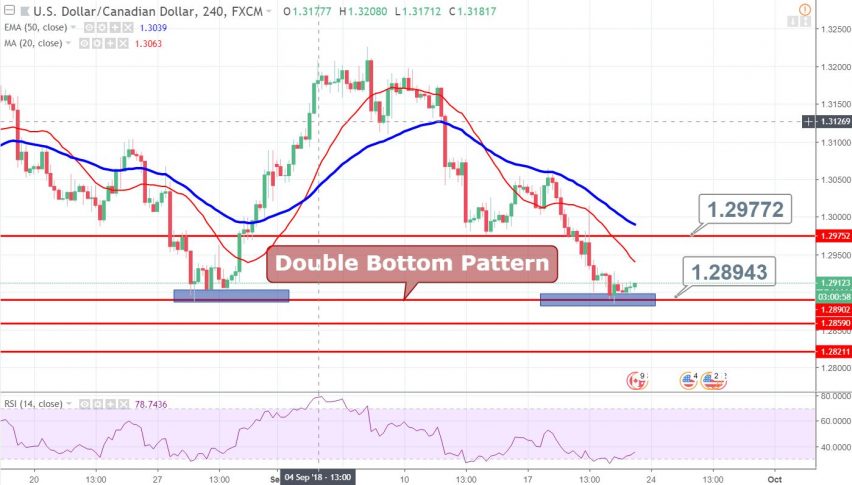
USD/CAD – Double Bottom Pattern In Play
Looking at the 4- hour chart, the USD/CAD pair is trading right above the double bottom pattern. This pattern is extending a significant support at $1.2895.
- The 20 & 50 periods EMA is suggesting a bearish bias of investors.
- The RSI is holding below 50, demonstrating the selling trend of the pair.
- The double bottom pattern may cause a bounce off above 1.2890.
- Investors will be waiting for the CPI figures to determine future trends of the market.

Positive CPI – Better than expected CPI may cause a violation of 1.2890 on a lower side and the pair can drop to 1.2850 and 1.2820.
Negative CPI – Worse than expected CPI may cause a bounce off above 1.2890 and it may lead the pair towards 1.2975.
Good luck and stay tuned to FX Leaders Economic Calendar for the live coverage of Canadian CPI figures!