USD Index Finally Makes the Decisive Move


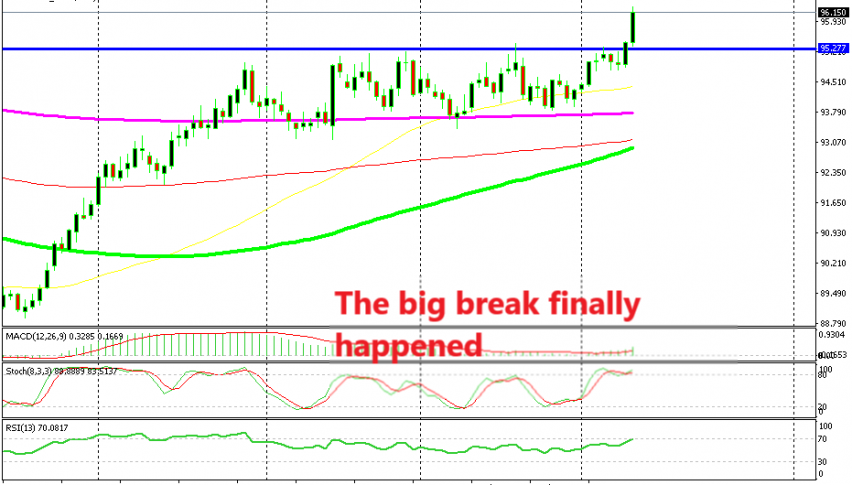
The US Dollar has been trading in a 300-350 pip range against the Euro during the last few months. The Euro has been pretty stable which means that this move has come from the USD side. If you look at the USD index daily chart you can see that this is true. I wrote about this last month when the USDX was trying to break the resistance level. The resistance area stood around the 95 level.
USDX buyers had tried at the resistance last week, the fifth in the last few months and they failed to break it once again. It was pierced for a moment but the price turned back down the same day and the daily candlestick didn’t close above it, so it doesn’t count as a break.
The price eventually returned down and formed a big bearish candlestick the next day. The reason for that was Donald Trump. If you remember, by the middle of July Trump said that the FED hiking interest rates goes against what his government is doing to improve the US economy.
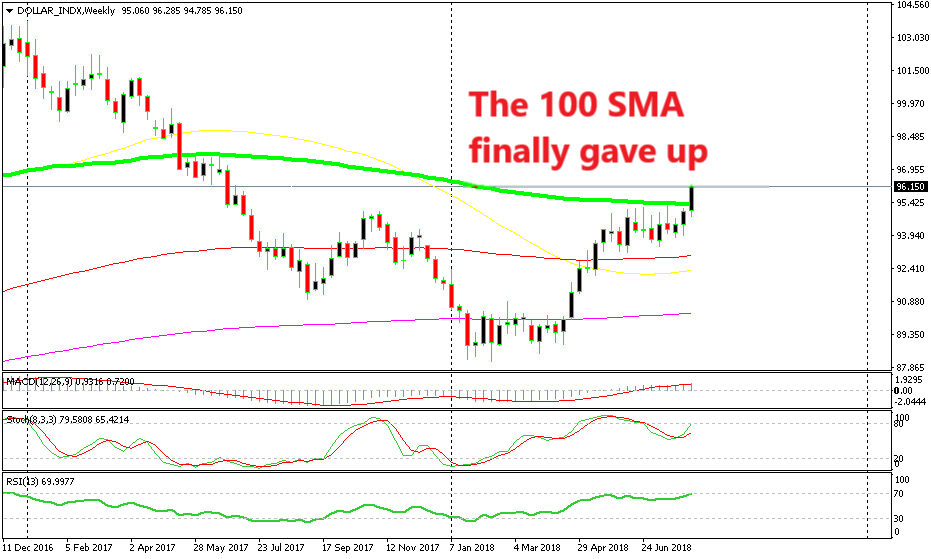
All moving averages have been broken
The USD took a dive the next day, although there was a technical reason as you can see from the weekly USDX chart above. The 100 SMA (grey) had been providing resistance to the USDX for some time and it helped reversing this index down last month. So, there was a technical and a fundamental reason for the reverse last month.
But the indicator at the bottom of the range held its ground again. That indicator is the 200 SMA (purple). Looking at the monthly chart, the picture became a bit depressing by the end of the month. The last two monthly candlesticks had formed two dojis and the stochastic indicator was overbought and it still is overbought.
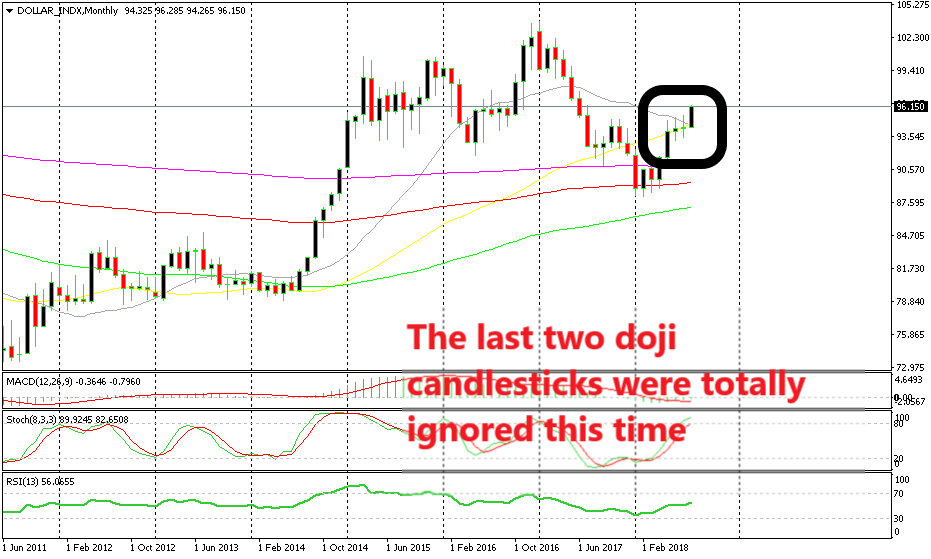
Dojis didn’t work
The technical picture looked terrible for buyers on both the monthly and the weekly charts. The picture didn’t look too bright on the daily chart either. But, the fundamentals finally triumphed this time. Donald Trump is not complaining about the strong USD lately and the sentiment in the financial markets has turned negative. This has led to demand for the USD and particularly for safe-haven currencies.
So, the USD buyers got a little bit of help from the deteriorating sentiment and they finally overcame this obstacle. They broke above the resistance at 95 points, they broke the 100 SMA on the weekly chart and they ignored the two doji candlesticks on the monthly chart. So, the USDX has finally made the bullish break and EUR/USD has made the bearish break at the same time. EUR/USD has broken below 1.15 for the first time in about a year.
Where does this point?
This points to more upside for the USDX and for the USD and to further downside in EUR/USD. Although, that will only happen if Donald Trump doesn’t interfere, and ruin things. We have to keep an eye on Trump all the time now, he loves the attention. So, USD buyers, I’d suggest that you follow his Twitter account.