Will the FED Hike Rates This Month? The Market Thinks So


I don’t know about you, but I really had fun in the markets today. The FX market made some decent moves here and there on the back of US Dollar strength. Stocks went absolutely crazy today. Most of the major global equity indices ripped higher, with even the sluggish Nikkei posting an impressive bounce. The S&P 500 broke to fresh all-time highs as it has done frequently in the last couple of months. And so we can go on.
Before we look at some indices, let’s first go to the currency market, which is, of course, much more liquid than all the global stock markets combined.
PS – If you like trading commodities, keep on reading! We’ll have a look at gold as well, which formed an irresistible bullish rejection candle today. Don’t miss out on this trading opportunity!
GBP/USD – Damaged By A Two Candle Reversal Torpedo
The GBP/USD took another beating today. It dropped for the fourth consecutive day and shed about 90 pips in today’s trading. The Pound ran into some trouble on Friday, when a strong two candle reversal was completed on the daily chart. Look at this:
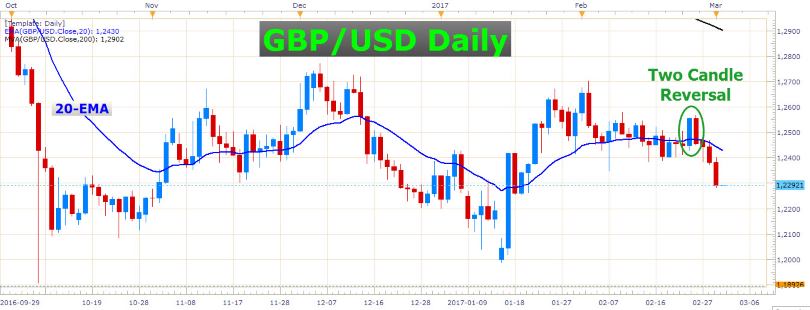 GBP/USD Daily Chart
This was a good opportunity to sell this pair. As you can see in this chart, this two candle reversal followed through with a some pretty good selling in the next three days.
The long-term trend is bearish, so this recent decline is in line with the bigger picture of this pair. This pair has been tricky to trade in the last few months, because of its directionlessness. Also, investor sentiment has been thrown all over the place, just like a small boat on a stormy sea. The waves being Brexit fears, and the sunny days the prospects of a “Soft Brexit” and continued participation in the Single European market.
The GBP/USD is trading below its 20-day exponential moving average again, and the outlook for this pair is clearly bearish for now. This pair remains sensitive to news regarding the Brexit theme. Keep this in mind when trading Cable (as the GBP/USD is also called).
USD/JPY – Supported for Now
The USD/JPY has run into some solid support in the last couple of weeks. The pair closed convincingly above its 20-day exponential moving average on Wednesday, and it looks like the bears are losing their grip once again. Here is a daily chart of this pair:
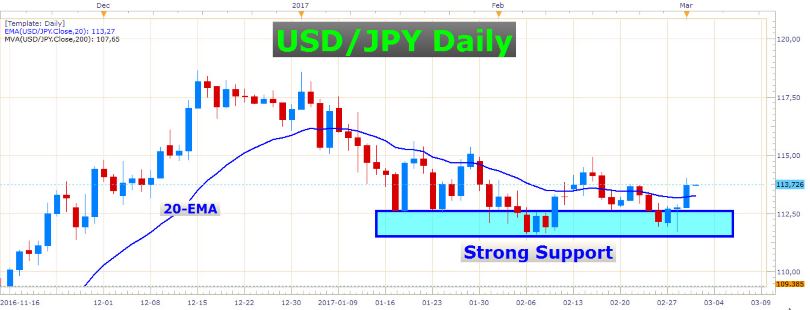 USD/JPY Daily Chart
The US Dollar traded higher against most of the major currencies on Wednesday. At the beginning of the week, the market didn’t really bet on an interest rate hike by the FED this month. Money market futures roughly priced in a 30% chance of a hike. On Wednesday, it had risen to about 70%. This tells us the market is suddenly in great expectation of a rate hike in March. Some FED speakers have been really hawkish in the last day or two. This has greatly contributed to the current market sentiment which fosters an imminent rate hike.
Looking ahead at the next couple of trading days, we need to be prepared for a further pricing in of a March rate hike. The current market reaction could easily produce more follow-through in terms of US Dollar strength, so keep an eye on this until we get the rate decision.
S&P 500 – No Brakes, Only Acceleration
This stock index is flying! If you want to experience a tremendously strong bull market, take part in the S&P 500. Here is a daily chart:
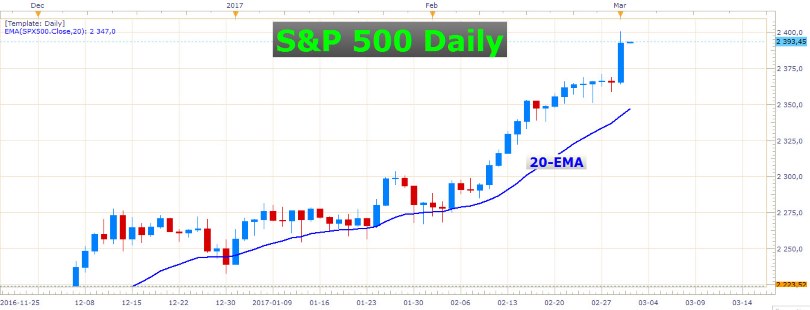 S&P 500 Daily Chart
What a splendid performance this was on Wednesday! No doubt, the current bullish momentum is really powerful. It can sometimes be difficult to get a really neat entry in such a one-sided market like the S&P is at the moment. Sometimes it helps to fine-tune your entries on a lower timeframe, like for instance a 4-hour chart, or even an hourly chart – if you know what you’re doing.
Gold – More Upside Expected
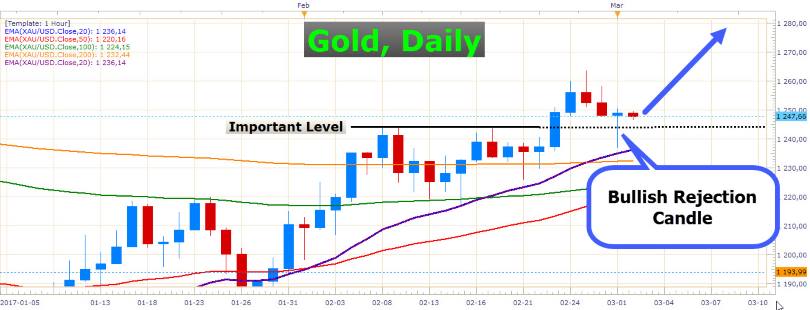 Gold Daily Chart
I really like this bullish rejection candle which formed at an important swing level as marked by the black horizontal line. This pinbar type of candle has a lot of power to produce bullish follow through, especially when it is found at such a significant level as the one in this chart. Long entries may be taken at the current market price, or even by trading a breakout of Wednesday’s candle (the one marked in the chart above).
Good luck!