WTI Crude Oil Forms a Bearish Reversing Pattern Below the 100 Daily SMA


WTI Crude Oil turned bearish towards the end of April and went through some substantial losses until the middle of June as the sentiment kept deteriorating in financial markets and risk assets kept sliding lower. But the decline stopped above the big round level at $50, which now seems to have formed a support zone above it.
The price bounced off that support area in the second half of June and in July US Crude Oil climbed above $60 for a short period of time. But the price turned bearish again after forming a coupe of doji signals on the daily chart, which signaled the reversal.
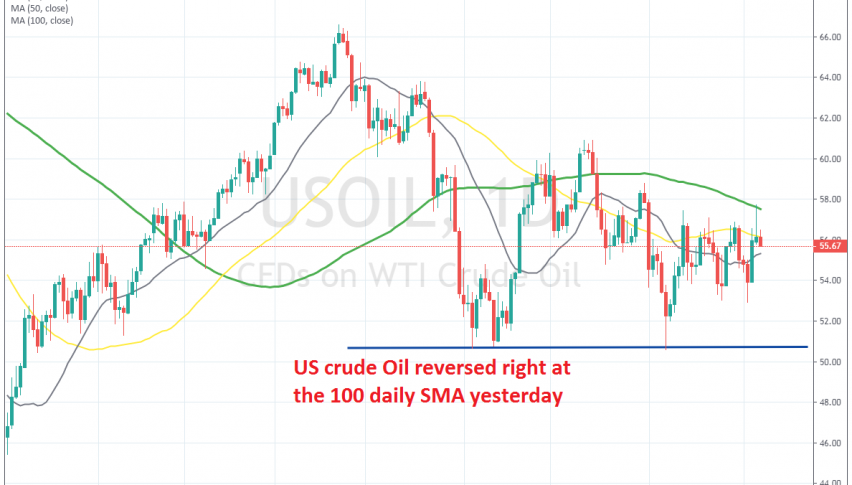
Since then, US Oil has traded sideways. In the last two days though, the price turned bullish again, but the climb ended at the 100 SMA (green). That moving average turned into resistance this week and yesterday’s candlestick closed as an upside-down hammer, which is a bearish reversing signal. Today’s candlestick looks sort of bearish already, so it seems that WTI crude is heading now for the bottom of the range again.
I suppose we should have gone short yesterday at the 100 SMA because the stop loss would be too wide now going short from here and placing it above yesterday’s high. Although, this is still a nice chart setup for sellers, so if you can afford it, you can sell here and target the support above $50.