WTI Crude Oil Retests Resistance- Are You Ready to Sell?


As advised in my previous update Sideways Range of Crude Oil – U.S. Final GDP Ahead, the Crude Oil was solely depending on the GDP figures of the World's Top Oil Consumer – the United States. Yesterday, their final GDP figures released as better than forecast at 3.1%, sharing a sentiment that the top Oil consumer will increase the demand for Crude Oil. But today, the market is solely depending upon the technicals. Let's take a look.
WTI Crude Oil – Technical View
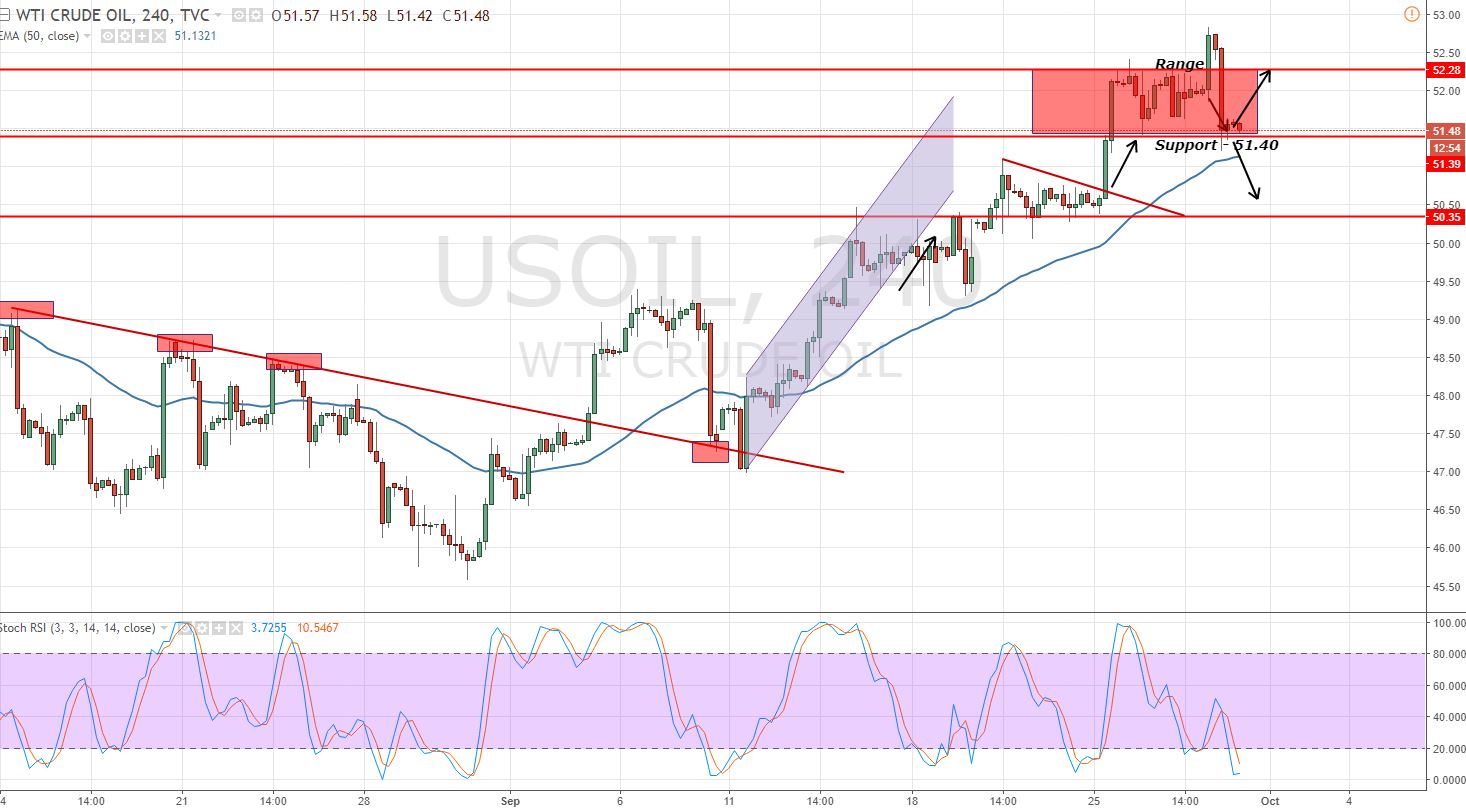
The Crude Oil is facing a strong support at $51.40. Remember, it's the same level that we discussed yesterday and the market is still respecting this level. Crude Oil prices have fallen below 50- periods EMA, which signifies a bearish bias of investors. The momentum indicator stochastics has entered the oversold region and it's likely to encourage bulls to enter the market.
 Crude Oil – 4 Hour Chart
 Crude Oil – 4 Hour Chart
Talking about trading levels, $51.60 is working as a solid resistance today. Break above this level is likely to lead the Oil towards $52.20. While below $51.40, it has a potential to go for $50.85 and $50.35.
Crude Oil Trading Plan
It's better to wait for a pull-up to back $51.75 in order to enter a sell position. The stop loss needs to be above $52 along with a take profit of $51.20. Good luck.