Trade Opportunities & Economic Events – Weekly Forecast 10th – 14th April


It really was a fantastic week filled with a good number of excellent trading opportunities. I hope you guys are following our Forex Trading Signals and analysis reports. By the way, our weekly forecast report for the past week was remarkably accurate. I will talk about it in the upcoming section along with several other things.
The Week Ahead – What To Watch For?
There were some major macroeconomic events and technical setups which are worth monitoring. We will first have a look at the top economic events for the week and later we will discuss the technical side.
Top Economic Events To Watch This Week
USD
- Fed Chair Yellen Speaks (Monday – 21:10)
- JOLTS Job Openings (Tuesday – 15:00)
- FOMC Member Kashkari Speaks (Tuesday- 18:45)
- Import Prices m/m (Wednesday – 13:30)
- Crude Oil Inventories (Wednesday – 15:30)
- PPI m/m (Thursday – 13:30)
- Unemployment Claims (Thursday – 13:30)
- Core PPI m/m (Thursday – 13:30)
- Prelim UoM Consumer Sentiment (Thursday – 15:00)
- CPI m/m (Friday- 13:30)
- Core CPI m/m (Friday- 13:30)
- Core Retail Sales m/m (Friday- 13:30)
- Retail Sales m/m (Friday- 13:30)
EUR
- German ZEW Economic Sentiment (Tuesday – 10:00)
GBP
- CPI y/y (Tuesday – 09:30)
- PPI Input m/m (Tuesday – 09:30)
- RPI y/y (Tuesday – 09:30)
- Average Earnings Index 3m/y (Wednesday – 09:30)
- Claimant Count Change (Wednesday – 09:30)
- Unemployment Rate (Wednesday – 09:30)
- BOE Credit Conditions Survey (Thursday- 09:30)
AUD
- NAB Business Confidence (Tuesday – 2:30)
- Employment Change (Thursday – 2:30)
- Unemployment Rate (Thursday – 2:30)
- RBA Financial Stability Review (Thursday – 2:30)
CAD
- BOC Monetary Policy Report (Wednesday – 15:00)
- BOC Rate Statement (Wednesday – 15:00)
- Overnight Rate (Wednesday – 15:00)
- BOC Press Conference (Wednesday – 16:15)
- Manufacturing Sales m/m (Thursday – 13:30)
- NHPI m/m (Thursday – 13:30)
EUR/USD – The Best Seller
If you remember, the EUR/USD was stuck in a narrow trading range of $1.0645 – $1.0699. It kept on consolidating in the same range for all of last week, except Friday. On that day, the pair finally broke out of the range after the release of mixed labor market data from the United States.
After the ECB meeting minutes and a speech by President Mario Draghi, it seems unlikely that they will raise rates before completing quantitative easing. This means that the investor sentiment for the April's meeting of the ECB remains neutral.
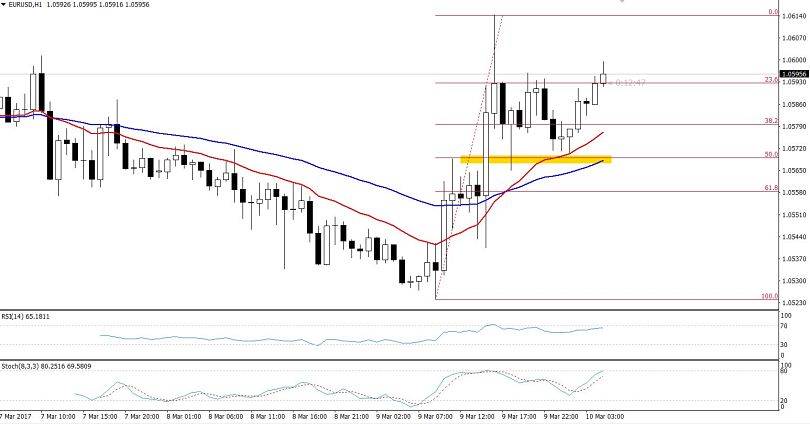 EURUSD – Hourly Chart
Technical Outlook – Weekly
This week, we have a limited number of economic events coming from the Eurozone. Consequently, the investors are likely to trade the technical tradings levels.
On that note, let us have a look at the daily chart of the EUR/USD. The pair is trading at $1.0590, right below a major support become resistance level of $1.0645. The RSI (relative strength index) has just crossed below a 50 which indicates that another bearish wave has just begun. Moreover, the 50 periods moving average is also favoring the RSI.
We can expect more sellers under $1.0645 with a target of $1.0500. Whereas, the breakage below $1.0500 is likely to lead the prices towards $1.0385. Hold on, am I sounding bearish?
There is one more factor to consider. In the daily timeframe, the EUR/USD has formed a bullish trendline which is extending support to the pair at $1.0550/70. Having said that, I will have more confidence to sell below $1.0550.
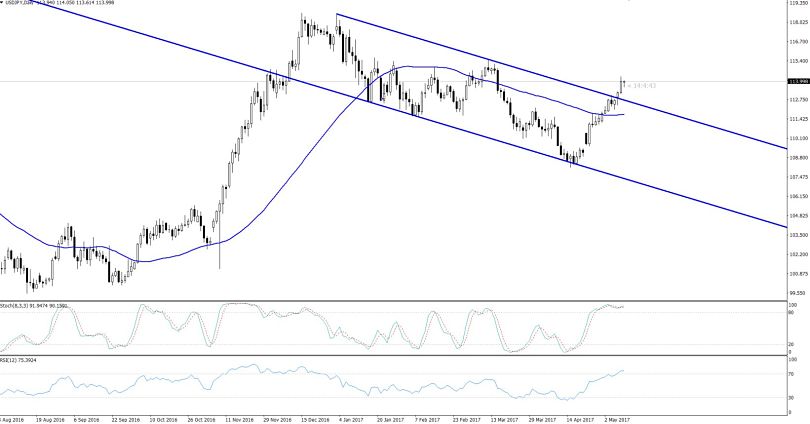
USD/JPY – Trade The Range
Despite the ongoing uncertainties, the USD/JPY has managed to maintain a trading range of $110.100 – $111.750. The prices moved almost as we predicated last week. In the previous week's forecast report, we recommended remaining in selling below $111.750 along with a target of $109.850. However, the market reversed from $110.109, but the trade remained at more than 140 pips profit.
This week we didn't see many notable economic events, but the BOJ, which is responsible for issuing the monetary policy, is scheduled to meet on April 26-27. I'm not expecting it to note any change in monetary policy this month.
 USDJPY – Hourly Chart
Technical Outlook – Weekly
In the daily chart, the USD/JPY is trading in a narrow range of $110.109 – $111.750. At the moment, the pair is trading at $111.075, below 50 periods EMA. Whereas, the RSI is holding below 50 which means it's in the favor of sellers. Moreover, the pair has also completed the 50% Fibonacci retracement around $110.
We can enjoy choppy trading in this pair until it breaks out of the range – such as buying above $110.109 and selling below $111.750. While the pair has a potential to target $107.850 only if it breaks below $110.109. We need to keep an eye on it and wait for a good opportunity.
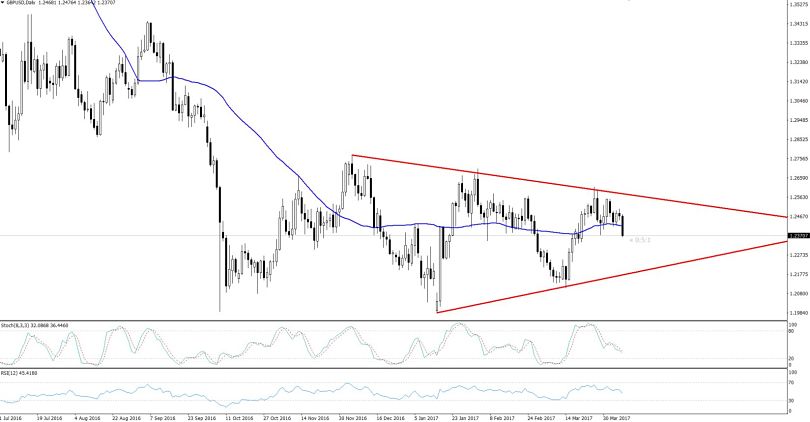
GBP/USD – Sellers Dominated
On Friday, the GBP/USD fell dramatically, ending in a loss of 1.4% for the week overall. This wasn't because of the weakness in the Sterling, but because of the boosted demand for the U.S dollar.
Of course, one of the major reasons behind a bullish trend in the dollar index was the release of the better-than-expected unemployment rate from the United States. Although, the U.S nonfarm payrolls figure was drastic, the major drop in rate compensated for the situation as the rate dropped to 4.5% from 4.7% (the lowest level in 10 years). This week, we need to focus on their inflation and labor market figures to determine further trends in the pound.
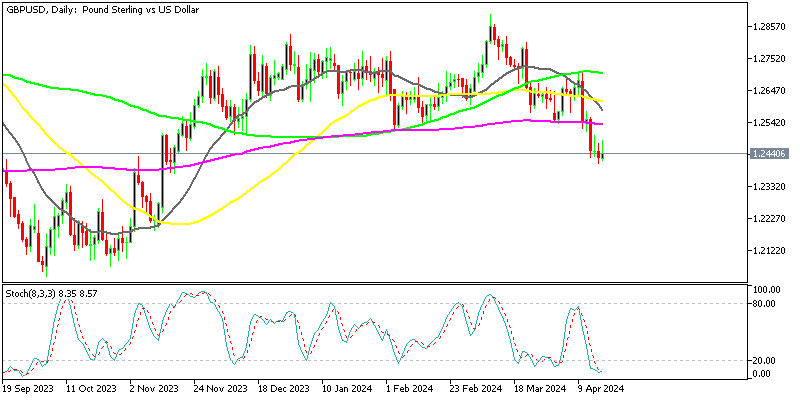
 GBPUSD – Daily Chart
Technical Outlook – Weekly
In our previous analysis report, we discussed the bearish flag in the 4 hours timeframe. The GBP/USD has broken lower from a bullish channel and has now formed a bearish flag pattern, which demonstrates an extension of the bearish trend. In addition to this, the 50 periods EMA is extending a strong resistance at $1.2425.
Besides that, we can see a sort of bearish marubozu candlestick pattern in the weekly timeframe along with the RSI holding at 45 is extending a major support to the selling trend.
Technically, the GBP/USD can find support at $1.2340, $1.2290 and $1.2201, whereas $1.2425 and $1.2510 are likely to work as a major resistance this week.
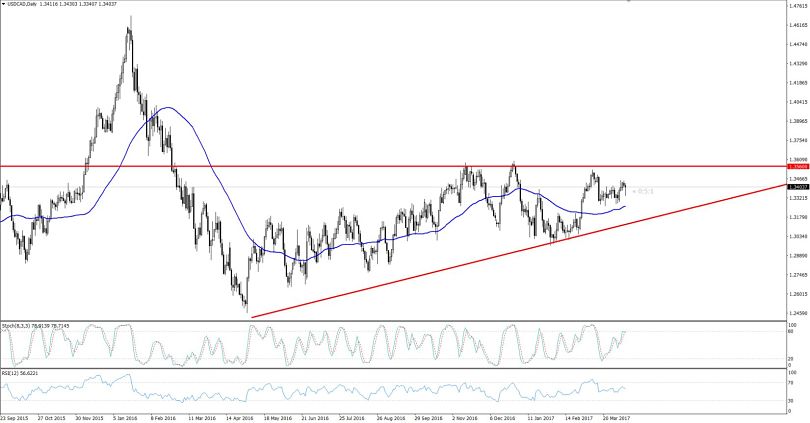
USD/CAD – The Commodity Currency
Last week, the Canadian dollar remained weaker compared to the U.S dollar as the pair soared nearly 150 pips to trade at $1.3403.
Of course, the pair has a strong positive correlation with the crude oil, but certainly, this is not happening right now. The oil prices are highly supported particularly after the U.S dropped the cruise missiles onto an air station in Syria, boosting the risk for conflict with Syrian supporters Russia and Iran.
But still, the Canadian dollar remained weaker against the U.S dollar. Normally, it never trades like this because the Canadian 70% revenue comes from the export of crude oil. Increased prices of the crude oil means foreign companies have to purchase more Canadian dollards to pay for the costly crude oil. As a result, the Canadian dollar strengthens.
In this week, the BOC (Bank of Canada) is supposed to release its monetary policy decision. I'm not expecting any change in the rate as the supported oil prices are likely to force the BOC to hold the rates unchanged.
 USD/CAD – Daily Chart
Technical Outlook – Weekly
Honestly speaking, the technical outlook of the pair is mixed as the pair is mostly trading in a choppy trade setup. At the moment, the USD/CAD is trading bullish at $1.3403, above a 50 period EMA along with the RSI above 50.
Aside from this, we can see an ascending triangle pattern in the weekly timeframe. Consequently, the pair is likely to find resistance at $1.3533 and support at $1.3290.
Looking at the weekly chart, we can see a bullish engulfing pattern. Of course, it's a bullish signal but still, it seems very risky to add buying on Monday. Let's wait a bit and give the market some time to settle from the shocks caused by mixed figures from the United States.
Conclusion
Lastly, let us watch the developments around the French Presidential election, as well as the Brexit negotiations very closely. However, I'm not expecting these to have much of an impact on the market. But, the issue of Syria is still in focus which can increase the uncertainties in the market – this will reflect on the stock market and we can see investors increasing their demand for haven assets.
Keep following us as we are going to share more updates and Forex trading signals this week. Good Luck!