Trade Setup In The WTI Crude Oil – An Asymmetric Triangle Pattern


The black gold, crude oil posted a second consecutive weekly decline over increased supply concerns. The crude oil has been stuck in a narrow trading range of $48.70 – 49.65. It has tried, but failed, multiple times to violate these levels.
The crude oil prices remained supported, despite the major draw in the inventories. Over the previous week, the Energy Information Administration reported a drop of 3.64 million barrels in the crude oil inventories. The draw was certainly higher than the previous figure of 1.04 million barrels. We were expecting a draw of around 1.3 million barrels. As a consequence, there was a huge buying trend in the crude oil and it placed a weekly high of $50.18. However, the overall inventories of crude oil still stand at 528.7 million barrels, which is 3.8% higher than last year's inventories.
The investors placed sell orders to make a profit in the overbought commodity. This week, we have high impact economic events from the United States, which are likely to help us in determining further trends in the crude oil and Gold.
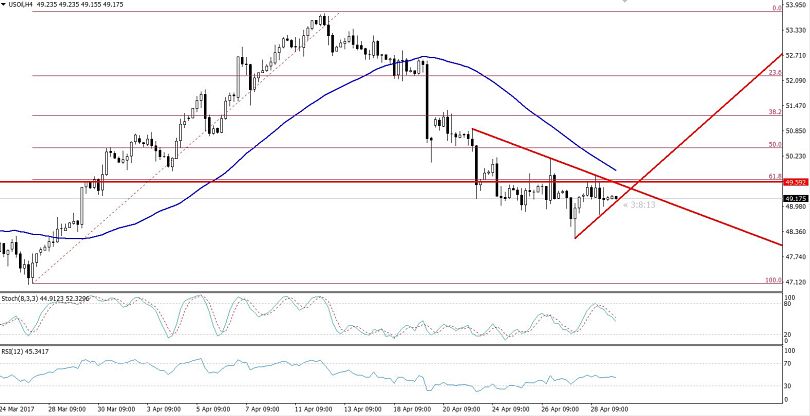
WTI Crude Oil – Asymmetric Triangle Pattern
Technical Outlook – Intraday
In the 4-hour chart, we can see a downward trend in the WTI crude oil, which indicates that buying entries are preferred over selling entrie at the moment. However, the RSI is holding below 50, which means, at this point, buying is not a good idea.
On the same chart, the oil has formed an asymmetric triangle pattern which is extending a support at $48.85 and resistance at $49.60. Let me add that the asymmetric triangle pattern is an indication of indecision amongst buyers and sellers.
Looking at the daily chart, the crude oil has been forming Doji and a spinning top for the last 4 days, giving us another signal that investors are waiting the solid fundamentals to bring some action in the crude oil. We do have several macroeconomic events releasing this week. To find out more about this week's fundamentals I would reommend reading our weekly forecast, Bustling Week With Major Trade Opportunities – 1 – 5 of May Weekly Forecast.
Forex Trading Signal
At this point, the crude oil is trading sideways with no clear trend. I'm going to wait for the breakout to catch a potential trading opportunity. However, I'm looking to add selling below $49 with a stop loss above $49.35 and take profit at $48.75.