Is Gold Going to Make a Big Bearish Reversal Now as it Faces Long-Term Resistance?
Gold has formed a reversing signal below long term resistance and it looks like it is about to turn bearish
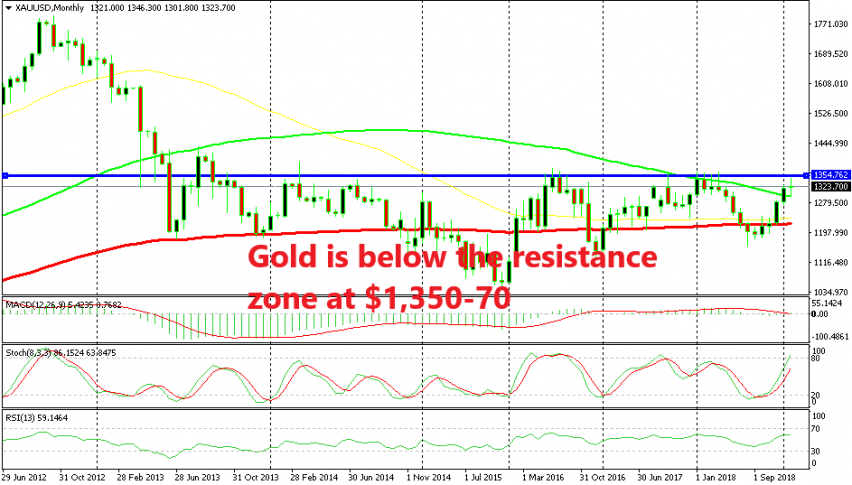
GOLD has made quite a reversal since October last year after it formed a doji candlestick in September on the monthly chart. Stochastic was oversold, so the reversal was predictable technically as well as fundamentally since the sentiment started to turn really negative at that time due to global politics.
Gold has gained nearly $200 from the lows to the high on Wednesday, as the market sentiment deteriorated further. But, it reached a zone where the price has reversed lower from before. In fact, Gold hasn’t been able to break this resistance zone since September 2013.
The resistance zone I’m talking about is somewhere around $1,350 and $1,370. That’s roughly speaking because such long term levels don’t work exactly to the pip; they come with a buffer zone. So, on Wednesday Gold peaked below this resistance zone at $1,346 on my platform as you can see from the monthly chart above, but it formed an upside-down hammer candlestick, as shown on the daily chart below.
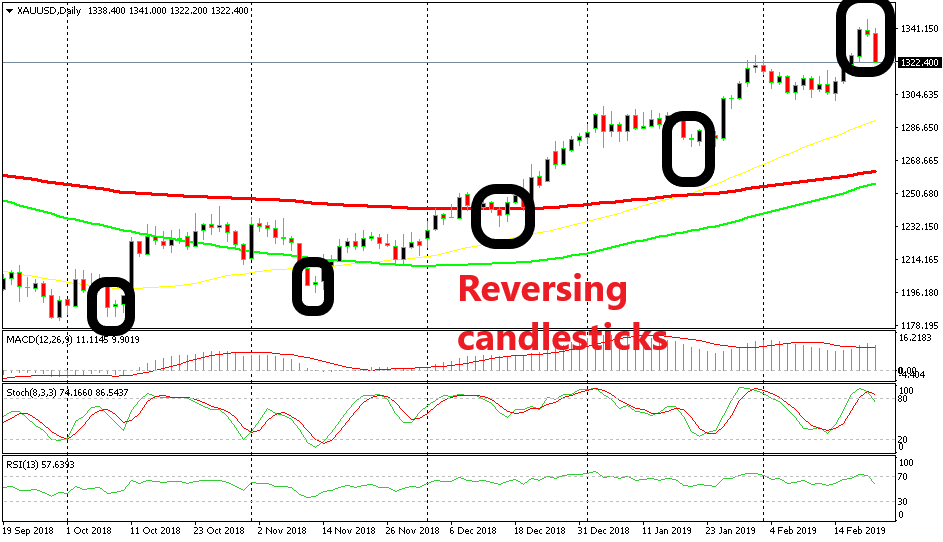
The upside-down hammer candlestick is a strong reversal indicator
That hammer is a really strong reversal signal. A similar signal formed in August when this big bullish reversal started. In fact, all the pullbacks lower have ended with similar candlesticks as shown on the black circles. Now, whether this will be a proper reversal of the longer term bullish trend or just a retrace lower remains to be seen. But, the indicators on the long term chart surely point to such a reversal.
If China and the US strike a deal soon and Brexit finally finds a solution then probably we might as well see a long term trend reversal. But, taking one step at a time, the reversal already started yesterday with a respectable nearly $20 decline as the big bearish candlestick shows.
- Check out our free forex signals
- Follow the top economic events on FX Leaders economic calendar
- Trade better, discover more Forex Trading Strategies
- Open a FREE Trading Account
- Read our latest reviews on: Avatrade, Exness, HFM and XM
Related Articles


Sidebar rates
Related Posts
