Gold Prices Skyrocketing – ABCD Pattern Signals $1,400
Gold has completed 38.2% Fibonacci retracement at $1,320 and right after that, bulls violated the B level at $1,342 to push gold around...
Earlier today, team FX Leaders managed to capture a sharp bullish movement in the precious metal gold. The buying was triggered on behalf of Federal Reserve rate cut expectations. GOLD prices traded bullish around 1,341, adding 0.92% for the day.
The US Federal Reserve isn’t expected to nor would it change rates at its meeting on June 19. Nonetheless, the markets are anticipating possibilities of a rate cut ahead of the year-end due to slowing inflation and rising trade tensions. For your info, a lower rate of interest reduces the opportunity cost of holding non-yielding metals.
On the technical side, gold has completed 38.2% Fibonacci retracement at $1,320 and right after that, bulls violated the B level at $1,342 to push gold around $1,352.
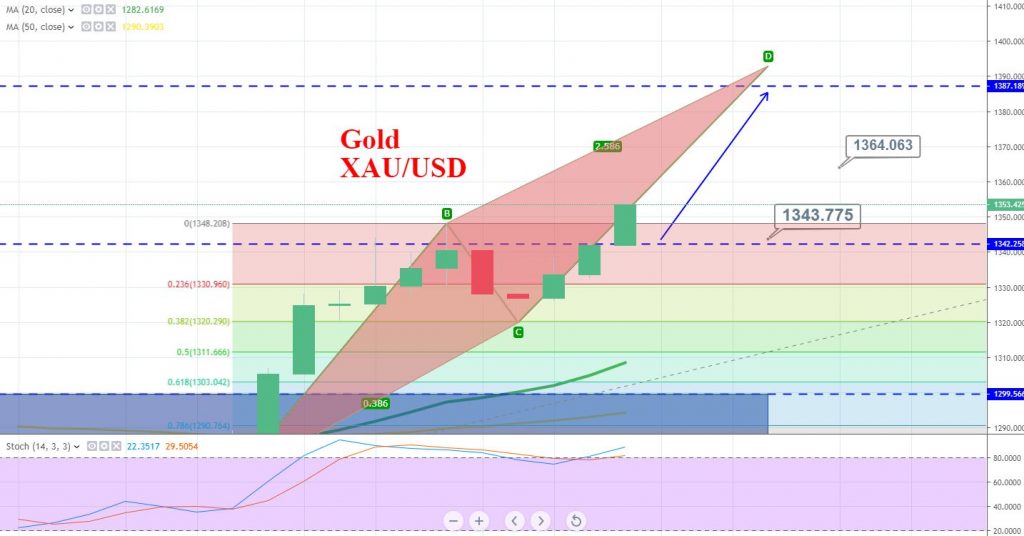
The ABC & D pattern seems to form here, where C to D wave is in production. C wave triggered at $1,320 level and technically it may push gold prices higher towards $1,400. Although it’s an aggressive forecast, that’s something suggested by technical analysis.
If anything changes, I will surely update you guys. Good luck!
- Check out our free forex signals
- Follow the top economic events on FX Leaders economic calendar
- Trade better, discover more Forex Trading Strategies
- Open a FREE Trading Account
- Read our latest reviews on: Avatrade, Exness, HFM and XM
Related Articles

Sidebar rates
Related Posts
