The Bearish Reversal Setup Doesn’t Materialize in Gold
Gold formed a bearish chart setup yesterday at the 20 SMA, but the pattern didn't unfold properly
GOLD has been really bullish this year, as the coronavirus outbreak hurt the risk sentiment, turning forex traders to safe havens such as Gold. But, the climb ended by the middle of last month and since then the highs have been getting lower, which is a sign that the pressure has shifted to the downside for now.
This month has been pretty bearish already, with Gold losing around $70 from top to bottom. Moving averages turned into resistance once the price fell below them, with the 20 SMA (grey) and the 50 SMA (yellow) ending the retrace higher last week on the H1 chart and reversing the price down.
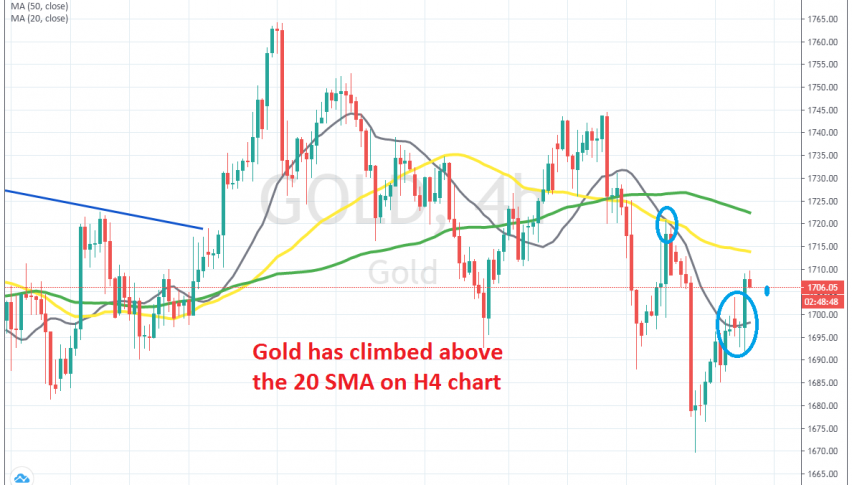
Yesterday we saw a pullback higher after a hammer candlestick at the bottom which is a reversing signal. Gold climbed higher to the 20 SMA which was providing resistance during the US session and the price formed a doji below it, which is a bearish reversing signal after the pullback.
So, we decided to open a sell forex signal in Gold based on this bearish reversal chart setup. The price fell around $10 lower but the reversal didn’t materialize in full and now Gold has moved above the 20 SMA. We moved the stop loss above the 50 SMA (yellow) to protect our trade, but at least the climb seems to have ended for now. Let’s hope sellers return and send the price back down again.
- Check out our free forex signals
- Follow the top economic events on FX Leaders economic calendar
- Trade better, discover more Forex Trading Strategies
- Open a FREE Trading Account
- Read our latest reviews on: Avatrade, Exness, HFM and XM
Related Articles


Sidebar rates
Related Posts
