Playing the Uptrend in EUR/GBP
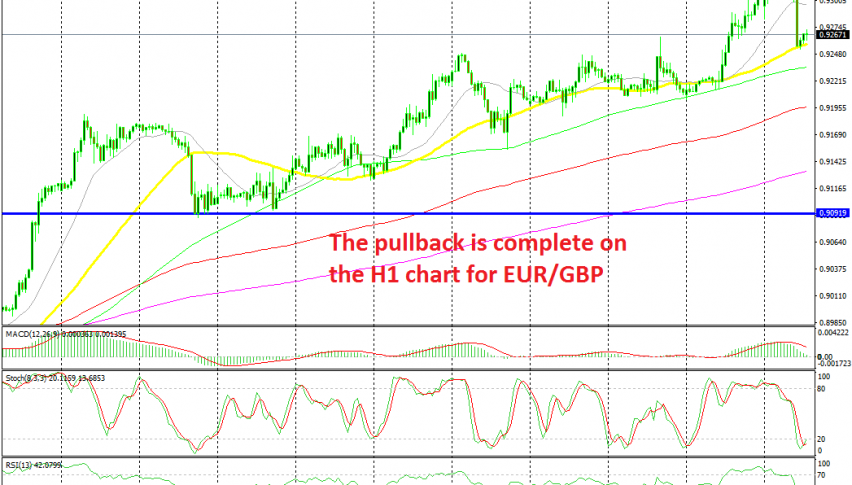
EUR/GBP has retraced lower on the H1 chart, but the 50 SMA is holding as support and it looks to be reversing higher now

EUR/GBP has been bullish for more than three months. The trend slowed in July and we even saw a decent pullback at the end of last month, but the 50 SMA (yellow) provided solid support on the daily chart and in the following weeks the pace picked up again as EUR/GBP surged around 440 pips higher, until last Friday.
Today we saw a 70 pip retrace lower as EUR/USD turned bearish and broke below last week’s lows. But, the 100 SMA held on the H1 chart on that pair. In EUR/GBP, it’s the 50 SMA which is holding on the H1 time-frame. This moving average has been providing support before for this pair and sometimes the 100 SMA (green) has helped as well.
The 50 SMA seems to be holding on for now as the price is reversing higher from it. The stochastic indicator is also oversold on this chart and now it is turning higher, which means that the retrace lower is complete on the H1 chart for this pair. We decided to go long a while ago at the 50 SMA, trying to play the trend after this pullback. So, we’re holding on to this trade, waiting for the bullish trend to resume.
- Check out our free forex signals
- Follow the top economic events on FX Leaders economic calendar
- Trade better, discover more Forex Trading Strategies
- Open a FREE Trading Account


