Gold Bounces Off the 100 Daily SMA, After Last Week’s Pullback
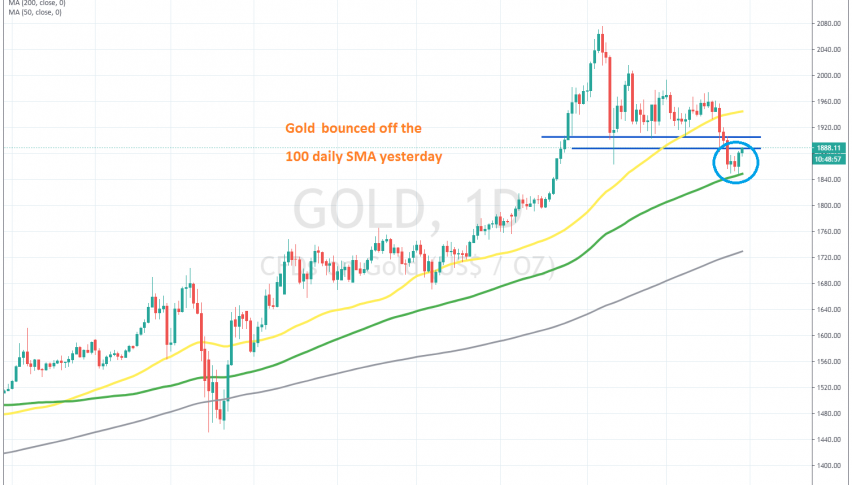
Gold has been retreating lower recently, but it bounced off the 100 daily SMA yesterday
GOLD has been really bullish for two years, as the trade war between the US and China has dented the risk sentiment in financial markets during this time, while this year, the coronavirus made traders panic and pile even more into safe havens.
As a result, Gold surged higher, breaking the previous all-time high at $ 1,900, and subsequently the big round level at $ 2,000, before reaching $ 2,075 in the first week of August. But we saw a reversal from there, and a steep pullback in the second week of August.
Since then, the highs have been getting lower, which is a bearish signal, and last week, the 50 SMA (yellow) was broken, together with the support levels at $ 1,900. But, the 100 SMA (green) held well as support on the daily chart in the first attempt, and yesterday we saw the price bounce off that moving average.
But, the climb stalled at the low of September 21, so we will see whether buyers will continue to push higher. If they do, we are looking to sell at the previous support of $ 1,900, which might turn into resistance, or at the the 50 daily SMA at around $ 1,950. But, we will decide when the price gets there, as long as the retrace higher continues.
- Check out our free forex signals
- Follow the top economic events on FX Leaders economic calendar
- Trade better, discover more Forex Trading Strategies
- Open a FREE Trading Account
Related Articles


Comments
Sidebar rates
Related Posts
