Is the Downtrend Over for USD/JPY, or Was It Just A Retrace?
USD/JPY has turned bullish this year, but the 200 daily SMA stopped the climb on Friday

Traditional safe havens have been behaving strange since August last year. They were on a bullish trend from March, when the lock-downs started in Europe but the precious metals stopped the climb in the second week of August and Gold and SILVER retreated lower.
In fact, Gold has turned quite bearish since then, losing more than $ 300 from top to bottom and the attempts from buyers to reverse the price higher have ended up in vain. That’s with the USD being on a strong bearish trend during this period, which makes the decline in GOLD even more pronounced. But, cryptocurrencies entered the safe haven market last year, gaining that status which is still pushing them higher.
Safe haven currencies have been gaining against the USD, with USD/JPY and USD/CHF losing around 9 cents and 12 cents respectively. But considering the large decline in the USD and compared to other major currencies, like the Euro, the GBP, AUD, CAD, NZD which have gained more than 20 cents against the USD, safe haven currencies have legged considerably.
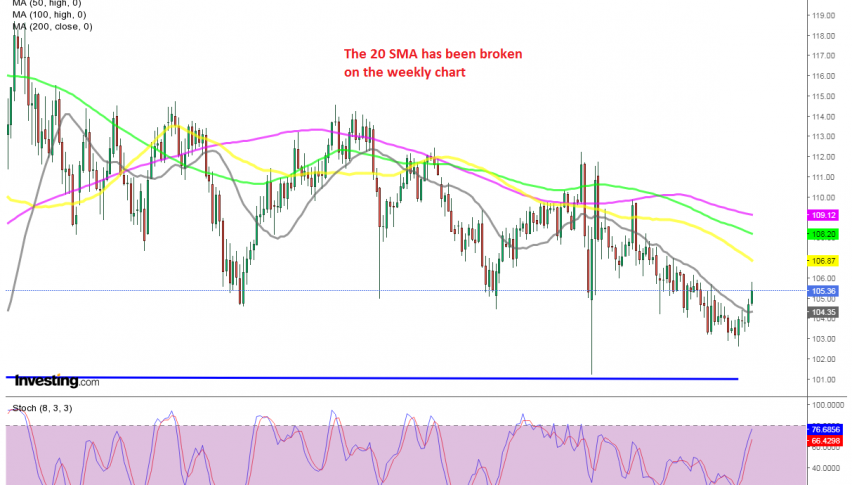
Although, the downtrend has continued with USD/JPY finding solid resistance at the 20 SMA (gray) on the weekly chart, which has been pushing the price down. But, since the first week of January, we have seen a bullish reversal in USD/JPY, which has taken the price more than 300 pips higher.
The USD has reversed higher against most major currencies, so the reason for the reversal in USD/JPY comes mainly form the USD. But safe havens have also been retreating as we mentioned above, with the safe haven currencies joining the precious metals down. Now the 20 SMA which was providing resistance on the weekly chart since June has been broken.

Although, it’s time for a retrace down to the 50 or 100 SMAs since stochastic on the daily chart is overbought
On the daily chart it was the 50 SMA (yellow) which used to provide resistance at the top. That moving average was broken during the bullish reversal, as well as the 100 SMA (green). But the 200 SMA (purple) rejected the price on Friday, after the soft US employment report for January, which was released that day. So, now the bullish reversal is in question.
If the long term downtrend is to end, then buyers should push above the 200 SMA, which would be a strong bullish signal. If the 20 SMA holds on the Daily chart and the price falls below the 20 SMA again on the weekly chart, then sellers will be in charge again.
- Check out our free forex signals
- Follow the top economic events on FX Leaders economic calendar
- Trade better, discover more Forex Trading Strategies
- Open a FREE Trading Account


