Will Gold Turn Bearish Now, After the Double Bottom Pattern Completed Its Course?
Gold has completed the double bottom pattern now
Gold had been bullish for two years when it turned lower in August lat year, at around $2,075 which was a record high for this precious metal. Since then Gold remained on a bearish trend, losing around $400 from top to bottom.
That bearish momentum continued until the end of March, when Gold bounced off the support at $1,675, where it seems to have formed a double bottom. This is a similar chart pattern to the double top, suggesting that the price will cover the same distance from the neckline, as the distance from the double bottom to the neckline.
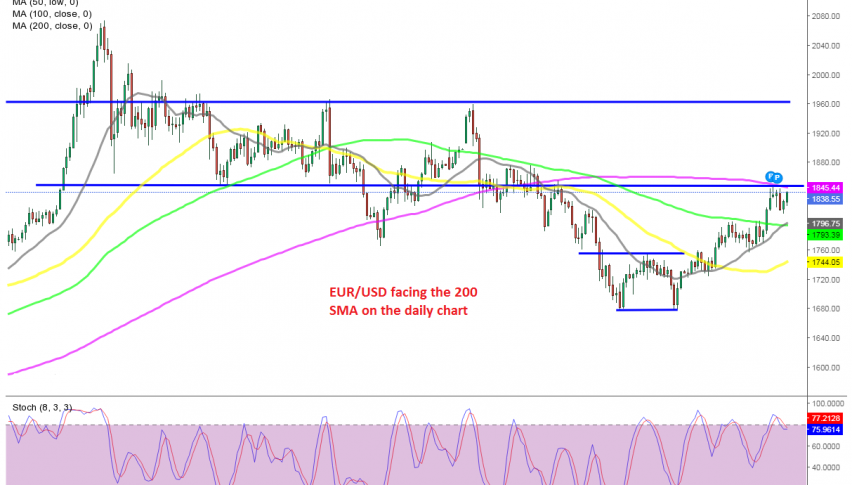
Looking at the daily chart above, we see that GOLD completed that course last week and its trying the upside again. But, bsides the buyers are facing the 200 SMA (purple) above now, besides the top of the double bottom pattern, which comes at the same area around the $1,845 level.
So the double bottom pattern is complete and the 200 SMA is standing ready to provide resistance above. But the USD has turned weaker again and it is pushing Gold higher. So, this is going to be a big test for Gold. If it fail, Gold will likely resume the larger downtrend and we will try to sell Gold. But, we will follow the price action next week to see if that’ll be the case.
- Check out our free forex signals
- Follow the top economic events on FX Leaders economic calendar
- Trade better, discover more Forex Trading Strategies
- Open a FREE Trading Account
- Read our latest reviews on: Avatrade, Exness, HFM and XM
Related Articles


Sidebar rates
Related Posts
