Gold Price Faces Bearish Consolidation, but Hopes Sparkle for Recovery
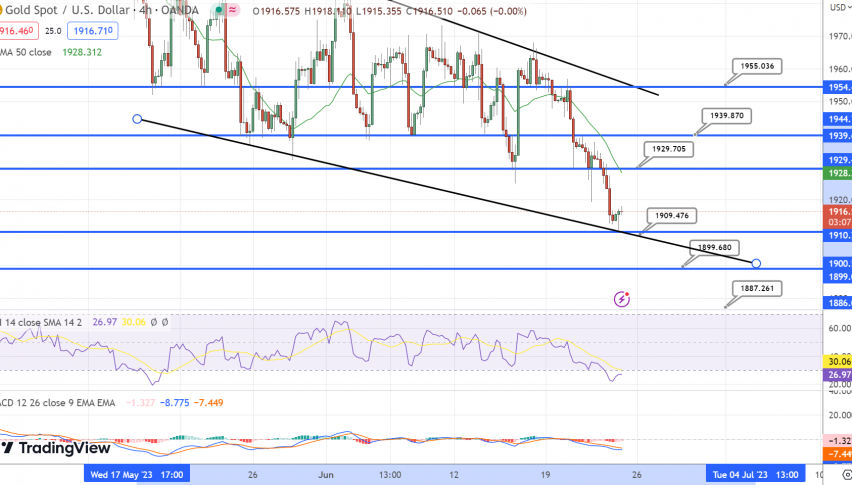
The gold price is currently in a bearish consolidation phase, hovering within a narrow trading range near the $1,915-$1,916 area after a recent dip.
Arslan Butt•Friday, June 23, 2023•2 min read
The recent rate hikes by the Bank of England, Swiss National Bank, Norges Bank, and others have exerted downward pressure on the non-yielding precious metal. Additionally, the US Dollar’s resilience, backed by Federal Reserve Chair Jerome Powell’s hints at further interest rate hikes, has restrained the US Dollar-denominated gold price.
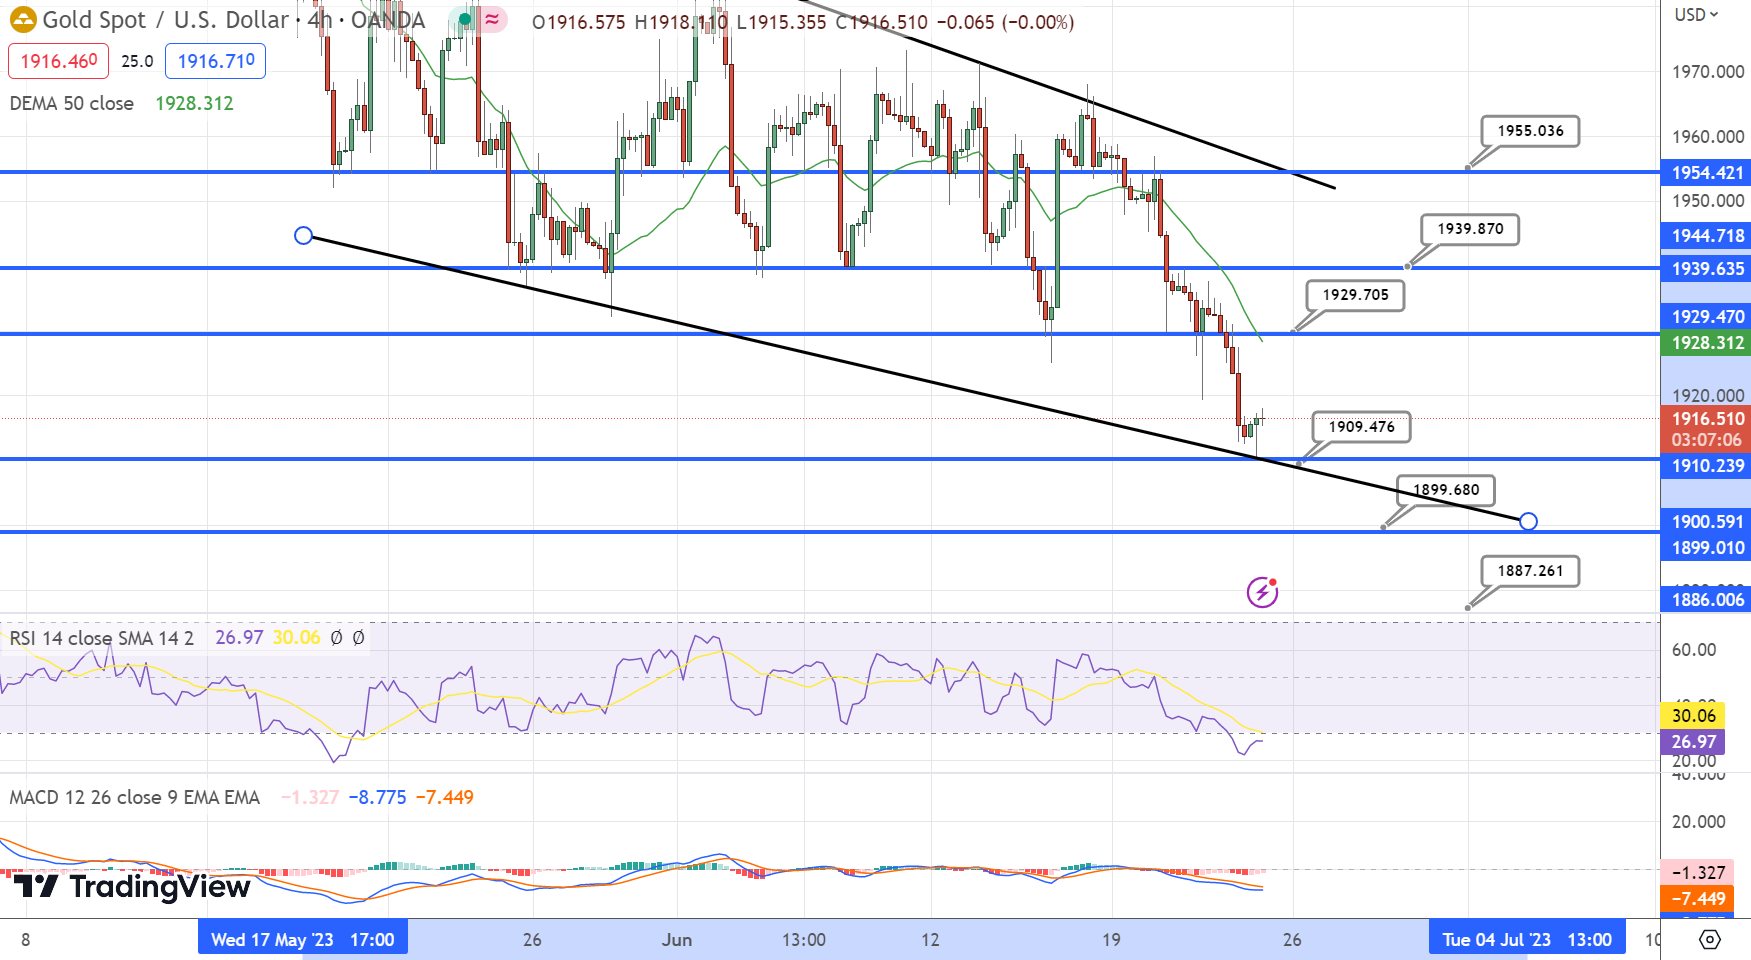
From a technical perspective, the sustained break below the 100-day Simple Moving Average (SMA) signals bearish momentum. Oscillators on the daily chart remain firmly in the bearish territory, suggesting further downside potential. This raises the possibility of gold sliding towards the $1,900 level, followed by the $1,876-$1,875 area and the significant 200-day SMA around $1,840.
- Check out our free forex signals
- Follow the top economic events on FX Leaders economic calendar
- Trade better, discover more Forex Trading Strategies
- Open a FREE Trading Account
ABOUT THE AUTHOR
See More
Arslan Butt
Index & Commodity Analyst
Arslan Butt serves as the Lead Commodities and Indices Analyst, bringing a wealth of expertise to the field. With an MBA in Behavioral Finance and active progress towards a Ph.D., Arslan possesses a deep understanding of market dynamics.His professional journey includes a significant role as a senior analyst at a leading brokerage firm, complementing his extensive experience as a market analyst and day trader. Adept in educating others, Arslan has a commendable track record as an instructor and public speaker.His incisive analyses, particularly within the realms of cryptocurrency and forex markets, are showcased across esteemed financial publications such as ForexCrunch, InsideBitcoins, and EconomyWatch, solidifying his reputation in the financial community.
Related Articles


Comments
Subscribe
Login
Please login to comment
0 Comments
Oldest
Sidebar rates
Related Posts
