AUD/USD Technical Analysis: Next target after 200 EMA is overhead at 0.6900

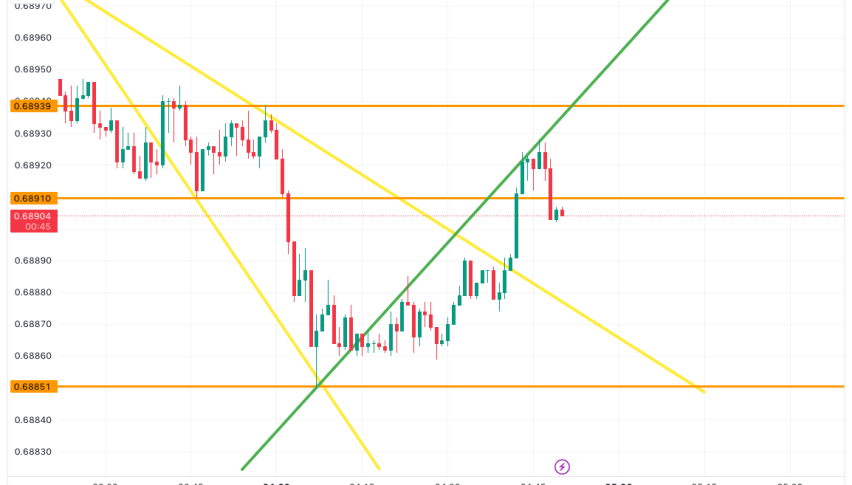
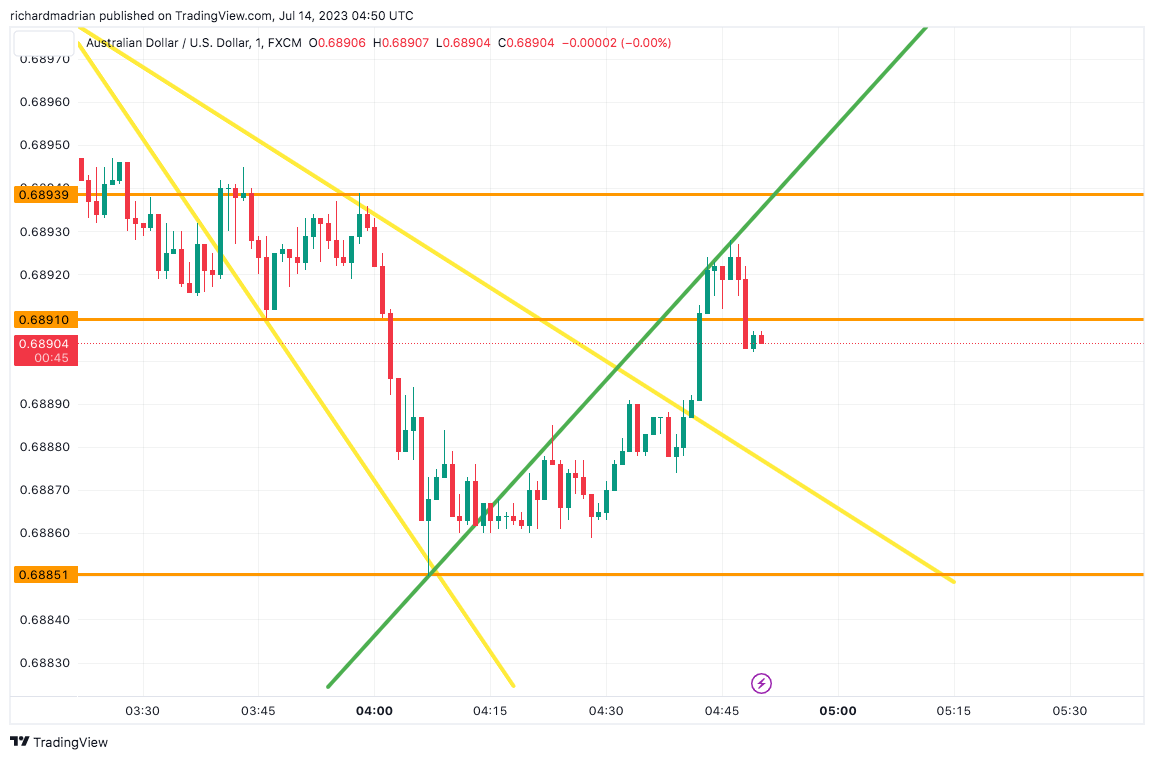
On the 4-hour time frame, the AUD/USD pair is currently consolidating within a narrow range of 0.6885 to 0.68939. The overall trend is bullish, indicating a favourable outlook for buyers. Momentum is building, suggesting a potential retest of the daily high at 0.68947.
However, it’s worth noting that the bulls have already made profits and are patiently waiting for the price action to test the monthly high of 0.6900 before considering new positions.
Conversely, if the price breaks below the critical support level of 0.6800, it could trigger a downward move, leading to a gradual decline towards the monthly lows of around 0.6600. Traders should closely monitor these key levels to make informed decisions regarding their trading strategies in the AUD/USD market.
The USD’s prolonged downward trajectory has raised concerns among market participants. The currency has faced consistent selling pressure, leading to a depreciation that has not been witnessed since April 2022. Traders and analysts are closely monitoring the situation, speculating on the possibility of a recovery if the Federal Reserve decides to end its rate-hiking cycle.
One factor that could provide support to the AUD/USD currency pair is China’s recent stimulus measures. China, Australia’s largest trading partner, has implemented various initiatives to stimulate its economy. These measures, aimed at boosting economic growth, are expected to have a positive impact on the Australian economy as well. As a result, the Australian dollar, acting as a proxy for China’s economic performance, is likely to benefit from this stimulus, thus strengthening the AUD/USD pair.
The AUD/USD currency pair is displaying a mix of signals based on various technical indicators. The 50-day Simple Moving Average (SMA) stands at 0.66854, indicating the average price over the past 50 days. In terms of oscillators, there is one sell signal, nine neutral signals, and one buy signal. This suggests that the market sentiment is predominantly neutral, with some slight selling pressure present. The indicators provide a similar picture, with one sell signal, ten neutral signals, and fourteen buy signals. This indicates a slightly more bullish sentiment among the indicators, with a majority favouring a buy position. When looking at moving averages, there is no sell signal, one neutral signal, and thirteen buy signals. This further supports the overall bullish sentiment, as the majority of moving averages indicate a buy position. Overall, while there are some mixed signals, the indicators and moving averages lean towards a bullish outlook for the AUD/USD pair.
AUD/USD daily 4-hour chart

- Check out our free forex signals
- Follow the top economic events on FX Leaders economic calendar
- Trade better, discover more Forex Trading Strategies
- Open a FREE Trading Account


