Forex Signals Brief July 14: USD Weakens, Economic Data in Focus
The US Dollar (USD) continued its downward trajectory against other major currencies on Thursday and during Asian trading on Friday

Yesterday’s Market Wrap
The US Dollar (USD) continued its downward trajectory against other major currencies on Thursday and during Asian trading on Friday. Although the US Dollar Index (DXY) touched its weakest level in 15 months at 99.57, it began to recover towards the 100.00 mark.
Noteworthy economic data on the US docket included the Import/Export Price Index and the University of Michigan’s (UoM) Consumer Sentiment Index. Additionally, Eurostat released Trade Balance data for May during European trading hours.
Following softer consumer inflation data on Wednesday, the US Bureau of Labor Statistics reported that the Producer Price Index (PPI) increased only 0.1% year-on-year in June. This data prompted a positive opening for Wall Street’s main indexes and a further decline in the 10-year US Treasury bond yield, which lost over 2% for the second consecutive day.
Consequently, the DXY turned bearish, breaking below the 100.00 level. Despite hawkish comments from Federal Reserve (Fed) policymakers, the USD failed to exhibit resilience. As a result, the DXY is down more than 2% for the week, signaling its largest one-week loss since November.
Today’s Market Expectations
Throughout the day, the European Economic and Financial Affairs Council (ECOFIN) meetings will take place, addressing important economic matters. At 12:30, the Canadian manufacturing sales month-over-month data will be released, showing an increase of 0.8% compared to the previous month’s 0.3%.
Additionally, the United States will unveil its import prices month-over-month figures, which indicate a slight decrease of -0.1% compared to the previous -0.6%. At 14:00, the preliminary University of Michigan (UoM) Consumer Sentiment index will be announced, with a reading of 65.5, up from the previous 64.4.
Alongside this, the UoM Inflation Expectations will also be published, indicating a figure of 3.3%. These economic events will provide valuable insights into the current state of the European and North American economies.
Forex Signals Update
We are delighted to report that the market has moved exactly in line with our forecasts, allowing us to achieve a 100% success rate. Our signals for BTC/USD, ETH/USD (Long Term), two signals on EUR/USD, and AUD/USD all closed at their respective take profit levels.
The EUR/USD sell signal opened at $1.12326 and is progressing as expected. Similarly, the BTC/USD sell signal, which was initiated at an entry price of $31188.7, is also moving favorably in line with our forecast. Furthermore, our Gold sell signal, which opened on $1957.07, demonstrates positive progress. We closely monitor these trades and will provide further updates as they develop.
Stay tuned for more detailed insights on our ongoing trading activities.
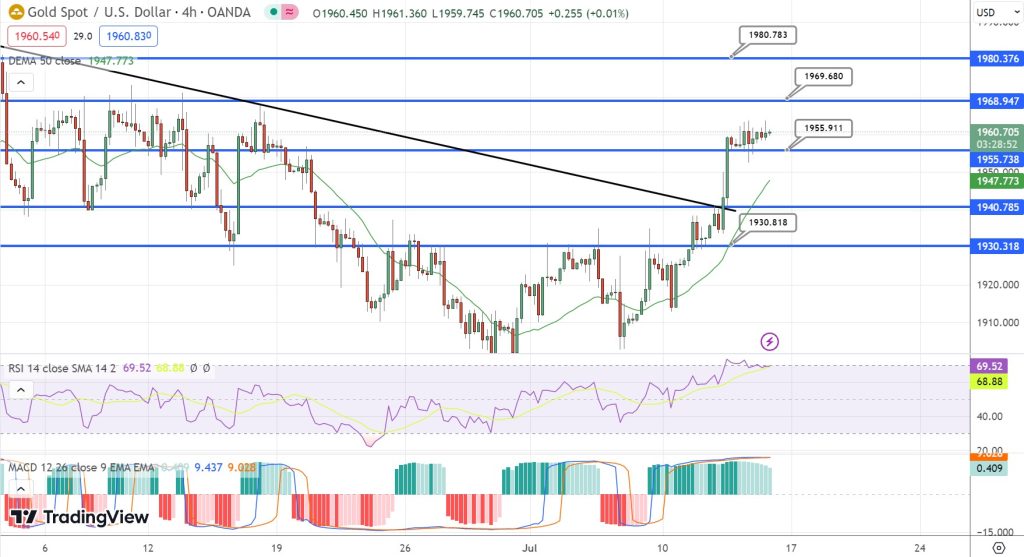
GOLD Ready for Correction
From a technical perspective, any potential upward movement in the gold price may encounter resistance in the $1,970 to $1,972 range, followed by the zone between $1,983 and $1,984. A breakthrough above this level could propel the gold price towards the $2,000 milestone, targeting the next obstacle around $2,010 to $2,012.
Conversely, the 100-day Simple Moving Average (SMA), currently located near the $1,954 to $1,953 range, appears to act as immediate support, followed by further support around $1,942. If the price falls below this level, there is a possibility of additional selling pressure that may push the gold price toward approximately $1,925.
Further, selling could potentially drive the price towards the $1,900 mark, ultimately returning to the multi-month low in the vicinity of $1,893.
Cryptocurrency Update
BITCOIN Steady Near $30,300
Bitcoin (BTC) rallied after Ripple’s XRP surge, breaking through resistance levels and consolidating above $31,000 and the 100-hour Simple Moving Average. Immediate resistance is at $31,600, followed by $31,800, with potential for a bullish momentum towards $32,000 and $32,500.
However, failure to surpass resistance could lead to a negative correction, with support at $31,200, $31,000, and further down to $30,800 and $30,550.

BTC/USD – 240 minute chart
However, Bitcoin has successfully maintained its position within the established price range. To manage risk effectively, we present the following trade parameters:
- Entry Price: $30,728.45
- Stop Loss: $29,728.45
- Take Profit: $31,728.45
- Check out our free forex signals
- Follow the top economic events on FX Leaders economic calendar
- Trade better, discover more Forex Trading Strategies
- Open a FREE Trading Account
Related Articles


Comments
Sidebar rates
Related Posts
