Gold Price Tumbles on Lower FED Rate Cut Odds After US Data
XAU made an incredible rally last week, with the Gold price increasing by $150 to record highs. But today we're seeing a pullback in Gold

XAU made an incredible rally last week, with the Gold price increasing by $150 to record highs. But today we’re seeing a pullback in Gold which was overdue actually, so it’s not too surprising. The stronger readings for the February CPI inflation in the US are also helping Gold sellers right now, as the USD is gaining some momentum.
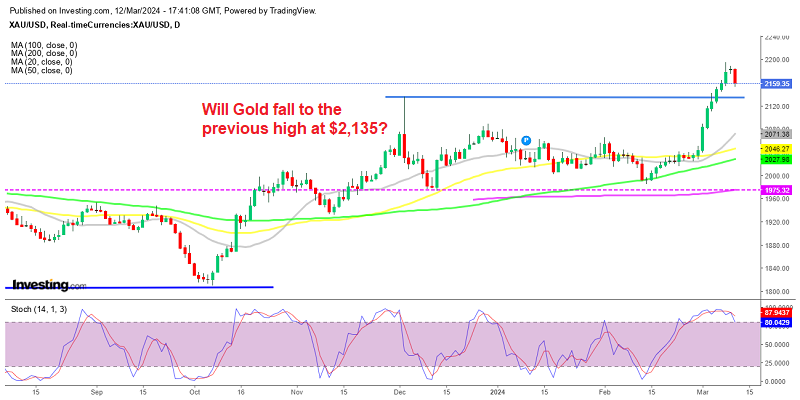
Gold Daily Chart – Reversing After the Doji Candlestick
Gold heading toward the previous all-time high at $2,135
The anticipation for a potential interest rate reduction as early as June, coupled with increased demand for safe-haven assets, propelled Gold prices to all-time highs in March, nearing $2,200 per ounce for spot prices. However, bullion prices (XAU/USD) are now facing significant selling pressure following the release of persistent Consumer Price Index (CPI) data for February by the United States Bureau of Labor Statistics (BLS) during Tuesday’s early New York session.
The CPI data revealed higher-than-expected inflation figures, which subsequently led to an uptick in yields on interest-bearing assets. Specifically, 10-year US Treasury yields experienced a sharp increase to 4.17%. Additionally, the US Dollar is making advances against all major currencies as the market reprices FED rate cut odds now. They were standing at 89 bps ahead of the US CPI inflation report.
These developments have exerted downward pressure on GOLD prices as investors adjust their expectations regarding monetary policy and interest rate movements. Higher inflationary pressures and rising yields on government bonds can make non-interest-bearing assets like gold less attractive in comparison. No XAU is under pressure as the Gold price falls below the tight range of the last three days, between $2,170 and $2,195, with the price falling below $2,160, with the first support zone coming at the previous high around $2,134-35. We are following the price action to see where the decline will stop, so we can go long in Gold.
Gold Live Chart
- Check out our free forex signals
- Follow the top economic events on FX Leaders economic calendar
- Trade better, discover more Forex Trading Strategies
- Open a FREE Trading Account


