The 0.85 Support Holds for EUR/GBP After Eurozone CPI Inflation
The larger picture of EUR/GBP continues to show a bearish trend, as highs keep getting lower. However, the support zone at 0.85 is holding

The larger picture of EUR/GBP continues to show a bearish trend, as highs keep getting lower. However, the support zone which has formed around 0.85 continues to hold since July last year and last week we saw a small bounce from there, but the bullish momentum seemed weak, which points to further downside pressure in the coming days and weeks.
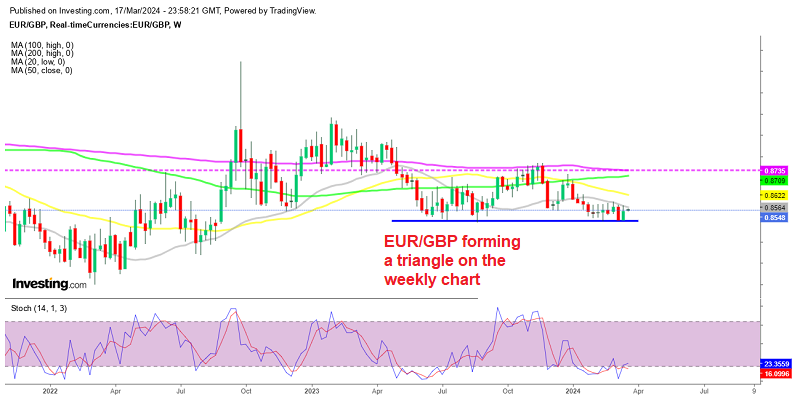
EUR/GBP Weekly Chart – The 20 SMA Is Acting As Resistance Now
This pair has been in a prolonged bearish trend for more than three years, characterized by lower tops. The trend has seen repeated attempts from buyers but they were met with resistance from sellers, with moving averages playing a role in this dynamic, as the weekly chart above shows. Despite occasional retraces higher, sellers have consistently pushed highs lower, indicating sustained negative pressure on the pair.
Early last week, EUR/GBP faced resistance at its 50-day simple moving average (SMA) of 0.8553. However, there were indications of a potential bullish reversal after the softer UK wages and employment figures, particularly with the formation of a bullish double bottom pattern around the base of 0.8500 which began in February. This pattern suggested the possibility of increased buying activity which materialized later in the week, sending the price 50 pips higher. But, moving averages have maintained their course, with the 20 SMA (gray) acting as resistance, which further supports the downtrend bias for this pair.
Today we had the final CPI (Consumer Price Index) reading from the Eurozone for February, which continues to remain on a falling trend, with the headline inflation figure declining from 3.3% in January to 3.1% in February, while core inflation also lost two points, falling from 2.8% to 2.6%. However, EUR/GBP will likely face challenges in establishing a clear direction until key events take place, such as the release of Consumer Price Index (CPI) data and the Bank of England (BoE) events later in the week.
EUR/GBP Live Chart
- Check out our free forex signals
- Follow the top economic events on FX Leaders economic calendar
- Trade better, discover more Forex Trading Strategies
- Open a FREE Trading Account


