EUR/USD Price Dips to 1.0825 Amid ECB Rate Cut Speculation and Economic Concerns
During the European trading hours, the EUR/USD pair continued its decline, hovering around 1.0825 due to the US Dollar's resurgence.
Arslan Butt•Wednesday, March 27, 2024•2 min read
During the European trading hours, the EUR/USD pair continued its decline, hovering around 1.0825 due to the US Dollar’s resurgence. Anticipation of a European Central Bank (ECB) rate cut in June, coupled with disappointing Eurozone economic indicators, has exerted downward pressure on the pair.
Key Factors Influencing EUR/USD Dynamics:
- ECB’s Potential June Rate Cut Dampens Euro’s Appeal: Speculation about an imminent ECB rate cut, fueled by comments from policymakers such as Madis Muller and Yannis Stournaras, has led to decreased confidence in the euro.
- Disappointing Eurozone Economic Data Challenges Euro: Recent economic figures from the Eurozone have failed to inspire confidence, raising concerns over potential ECB policy easing amidst uncertain economic conditions.
- US Dollar Strengthens Amid Positive Economic Signals and Fed Policy: The US dollar’s strength, driven by optimistic US economic data and expectations of the Federal Reserve maintaining high-interest rates to counter inflation, has contributed to the EUR/USD pair’s decline.
The EUR/USD pair faces downward pressure, largely attributed to heightened expectations of a June ECB rate cut, which has diminished the euro’s attractiveness. Policymakers’ openness to reducing rates has spurred speculation, impacting the euro’s valuation negatively.
Moreover, underwhelming Eurozone economic data has amplified concerns regarding the ECB’s monetary policy direction, further weakening the euro against a robust US dollar.
On the flip side, the US dollar benefits from a positive economic outlook and the anticipation of sustained high interest rates by the Fed, putting additional strain on the EUR/USD exchange rate.
EUR/USD Price Forecast
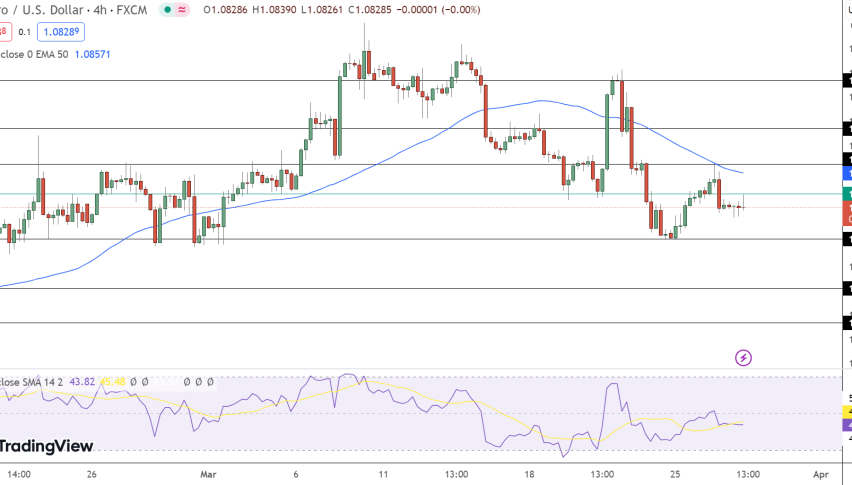
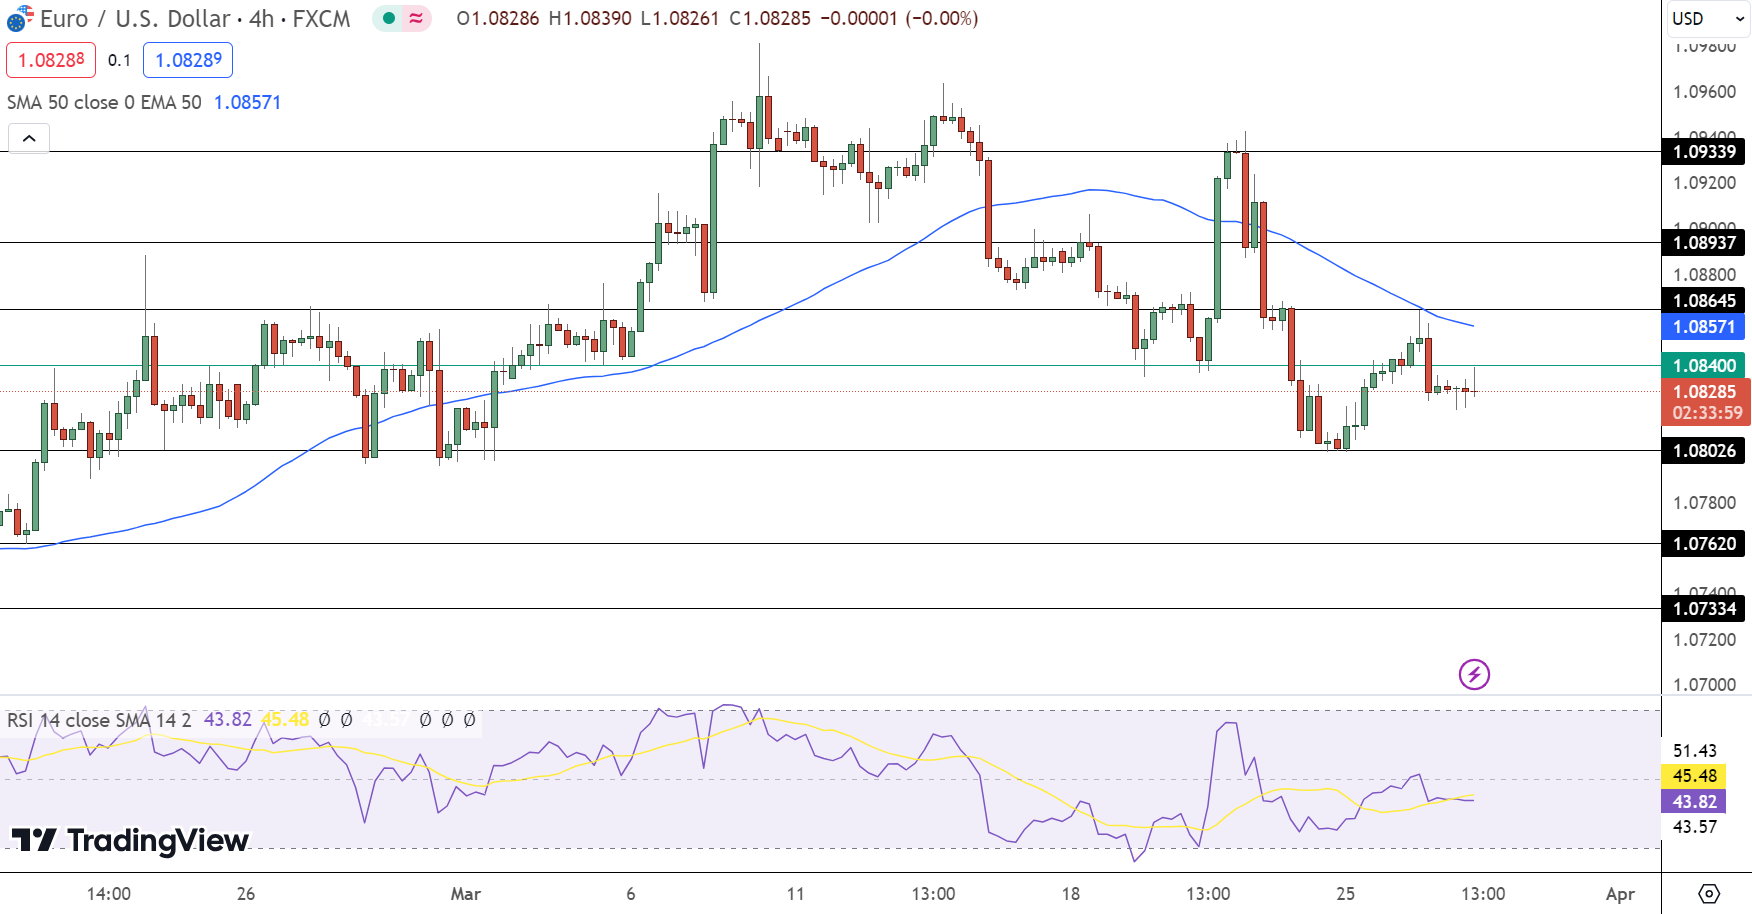
The EUR/USD pair edged down by 0.02%, settling at 1.08285, reflecting a cautious stance among traders. Key technical levels highlight a pivot point at 1.0840, suggesting a bearish sentiment beneath this marker.

Resistance is identified incrementally at 1.0865, 1.0894, and 1.0934, posing potential hurdles for any upward momentum. Conversely, support levels at 1.0803, 1.0762, and 1.0733 offer foundations against further declines.
Technical indicators, including a Relative Strength Index (RSI) at 43 and the 50-day Exponential Moving Average (EMA) at 1.0857, underscore the current bearish outlook.
A decisive move above the pivot could shift the bias towards a bullish trend, indicating a critical juncture for the currency pair’s near-term direction.
- Check out our free forex signals
- Follow the top economic events on FX Leaders economic calendar
- Trade better, discover more Forex Trading Strategies
- Open a FREE Trading Account
ABOUT THE AUTHOR
See More
Arslan Butt
Index & Commodity Analyst
Arslan Butt serves as the Lead Commodities and Indices Analyst, bringing a wealth of expertise to the field. With an MBA in Behavioral Finance and active progress towards a Ph.D., Arslan possesses a deep understanding of market dynamics.His professional journey includes a significant role as a senior analyst at a leading brokerage firm, complementing his extensive experience as a market analyst and day trader. Adept in educating others, Arslan has a commendable track record as an instructor and public speaker.His incisive analyses, particularly within the realms of cryptocurrency and forex markets, are showcased across esteemed financial publications such as ForexCrunch, InsideBitcoins, and EconomyWatch, solidifying his reputation in the financial community.
Related Articles
Comments
0
0
votes
Article Rating
Subscribe
Login
Please login to comment
0 Comments
Oldest
Newest
Most Voted
Inline Feedbacks
View all comments
