What is RSI (Relative Strength Index)?
The relative strength index (RSI) is an indicator used in the technical analysis of financial assets. The RSI aims to display the current and historical strength or weakness of a security based on the closing prices of a recent trading period. When it comes to RSI trading, the relative strength index has more to offer than just displaying the strengths and weaknesses of an underlying asset. In fact, there are numerous strategies involving the relative strength index.
This article aims to give you a firm grasp of what the RSI is all about.
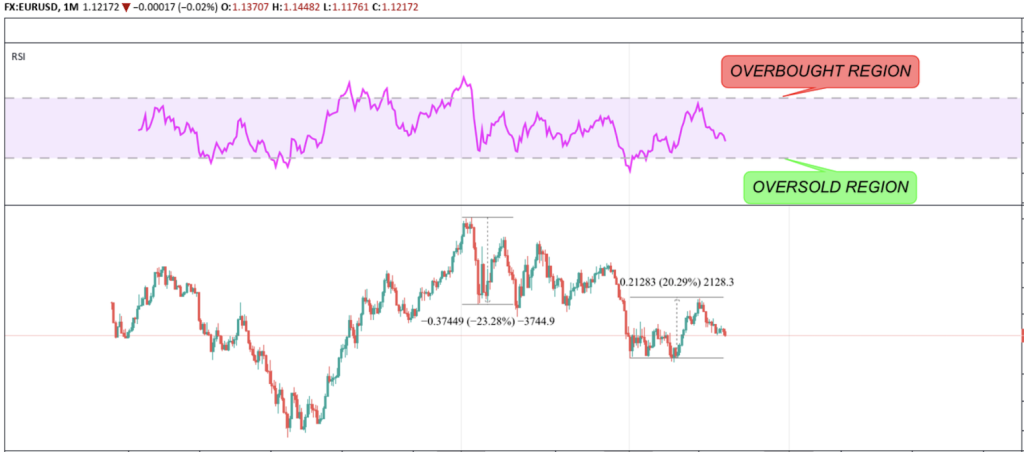
The Relative Strength Index (RSI) is shown as the purple wave in the example below. As you can see, there are two dotted lines, one at the top and one at the bottom. If the RSI goes above the line, the RSI signals us that the price is in overbought regions, indicating that there will be a sell-off soon enough. This holds true in the opposite way as well, if the RSI falls below the line at the bottom. If the RSI touches oversold regions, it implies that the recent drop will soon come to an end and there will be a wave towards the upside in the not-too-distant future.

As seen below, the RSI touching or overreaching the dotted lines often resulted in tremendous price movements in the opposite direction. Thus, the RSI is a very powerful tool to find entry and exit points for long and short positions.
Is trading with oscillators like the RSI profitable?
Yes, indeed, it can be very profitable. To understand how to make profits using the relative strength index indicator, we must first dive into several strategies involving the RSI.
The simplest strategy is to buy the security or market when the RSI is in oversold regions in a higher timeframe, like the daily, weekly or the monthly chart.
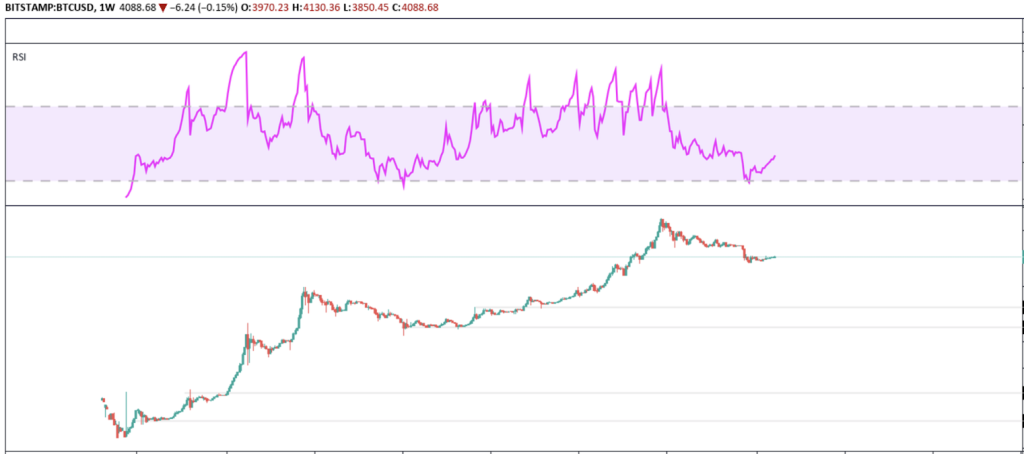
In the example above, you would have entered a long position on Bitcoin somewhere around $4.50 and would have sold your position when the RSI reached overbought regions, which happened around $14.50. You then would have waited until the RSI reached oversold regions to buy Bitcoin again, which was around $220. As the RSI reached overbought regions again, you would have sold your position at around $500.
This means, your first trade would have tripled your invested capital while your second trade more than doubled it. Assuming you would have invested $1000 by your first order, you would have ended up with $6000 in a time-horizon of four years.
You might think this must be a fantastic strategy then, right? Well, the answer might surprise you, but this strategy has some weaknesses.
First of all, you never know how far the RSI goes after reaching overbought or oversold regions. In the example below, the price declined another 37.6 percent after reaching oversold regions in the daily chart. However, from its lowest point at RSI = 18, it surged by 67 percent until it reached overbought regions again.
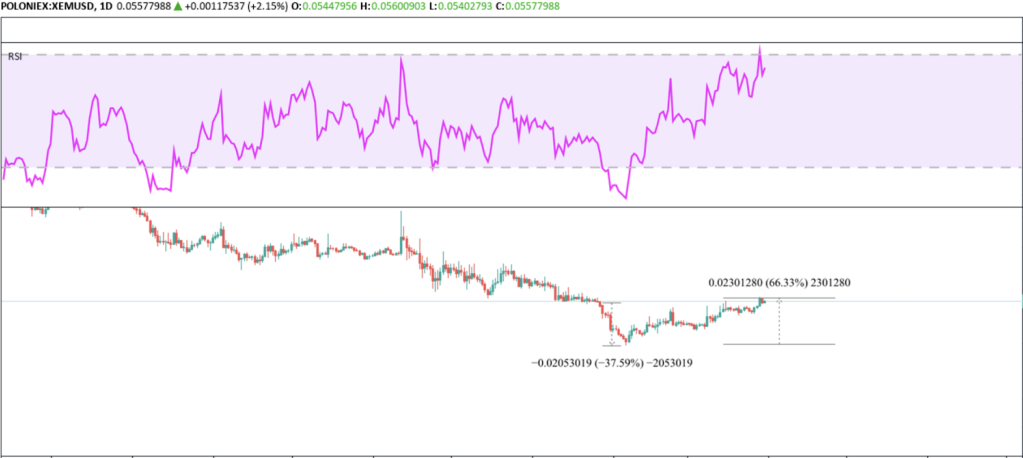
Thus, buying at very low RSI levels, between 0-20, will pay off almost every time, if you have the patience and determination to wait for the next exit point.
However, this only works if we assume that the underlying asset or security recovers at all, since a price going to zero will continue the downtrend no matter how low the RSI has reached.
Another problem with this strategy is that you will miss a lot of the price surge. If we look at Bitcoin from the previous example, you would have sextupled your money but Bitcoin actually increased by 11300 percent in the meantime. This is due to the fact the price increased significantly without ever touching oversold or oversold regions while surging.
Consequently, the strategy can work, but there are better strategies out there.
Is the RSI a good indicator for investing and trading purposes?
The RSI is one of the most popular trading tools, however, it is rarely used as investment aid. Investing means you are confident that the underlying asset will be worth more in the future due to fundamental reasons. Consequently, as an investor, you shouldn’t care about the price fluctuations and you might only take the RSI to find an entry point and then forget about it.
In contrary to traders who are buying and selling at a much higher frequency, the RSI makes a perfect tool to use for several strategies.
What’s the best way to use the RSI indicator?
It is particularly hard to declare something as the best, but there are definitely very well studied and proven strategies involving the relative strength index.
One of the most reliable among these is to trade bullish and bearish divergences.

In the chart below, the RSI shows a bearish divergence. If the price surges while the RSI performs lower highs, it indicates that there will be a (massive) sell-off in the near future. The bigger the timeframe, the bigger the price movement. In this example, EUR/USD lost 15 percent after the divergence formed over two years in the monthly chart.
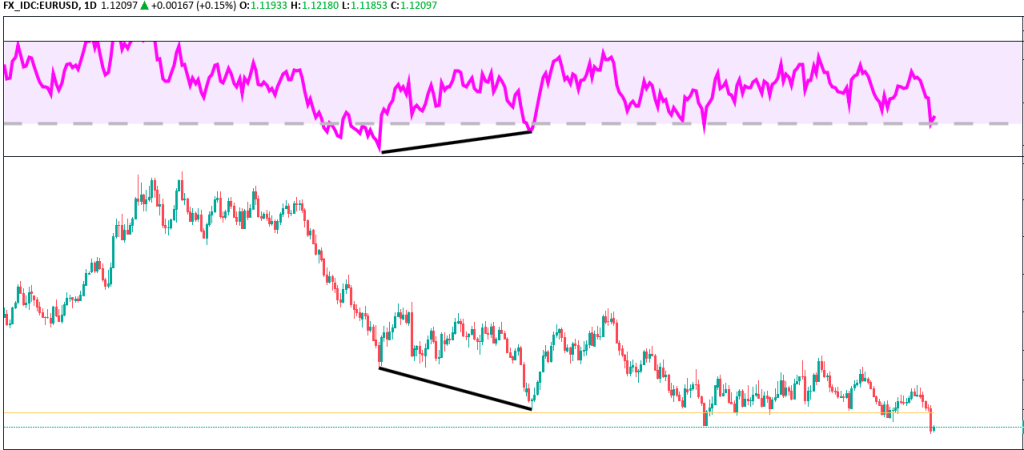
In the bull scenario seen below, the RSI forms higher lows while the price is performing lower lows. In this case, the price climbed nearly 5 percent after the bullish divergence formed in the daily chart.
To conclude, the RSI is an excellent trading tool for day trading and swing trading.
However, simply buying at oversold regions and selling at overbought regions might be very risky and lead to losses or fewer gains.
After all, it is safe to say that the relative strength index is one of the best indicators that technical analysis has to offer. Thus, trading bullish and bearish divergences in the RSI is a proven method to make your trading more profitable.
About the author
Sidebar rates
