Prices Forecast: Technical Analysis
For the daily forecast, Stellar is expected to close at approximately $0.2350, with a range between $0.2300 and $0.2400. On a weekly basis, the closing price is predicted to be around $0.2380, with a range from $0.2300 to $0.2450. The RSI at 36.34 suggests a bearish trend, indicating potential oversold conditions, which might lead to a short-term rebound. The ATR of 0.0109 points to moderate volatility, while the ADX at 24.169 indicates a weak trend. The MACD line is below the signal line, reinforcing the bearish sentiment. However, the proximity of the price to the pivot point at $0.23 suggests potential support, which could stabilize the price in the short term.
Fundamental Overview and Analysis
Stellar’s recent price trend shows a decline, with the last closing price at $0.2344. This decline is influenced by broader market conditions and investor sentiment. The economic calendar highlights stable inflation rates in Europe and moderate consumer spending in the US, which could indirectly affect Stellar’s market dynamics. Stellar’s value is driven by its utility in cross-border transactions and partnerships with financial institutions. However, competition from other blockchain platforms and regulatory challenges pose risks. Despite these challenges, Stellar’s scalability and low transaction costs offer growth opportunities. Currently, Stellar appears undervalued, presenting a potential buying opportunity for long-term investors.
Outlook for Stellar
Stellar’s future outlook is cautiously optimistic, with potential for recovery as market conditions stabilize. Historical price movements indicate a pattern of volatility, influenced by macroeconomic factors and technological advancements. In the short term (1 to 6 months), Stellar’s price could see modest gains if market sentiment improves and regulatory clarity emerges. Long-term forecasts (1 to 5 years) suggest potential growth driven by increased adoption and technological innovations. However, external factors such as geopolitical tensions or market crashes could impact prices. Investors should monitor economic indicators and industry developments to make informed decisions.
Technical Analysis
Current Price Overview: The current price of Stellar is $0.2344, slightly below the previous close of $0.2344. Over the last 24 hours, the price has shown a downward trend with moderate volatility, lacking significant bullish momentum.
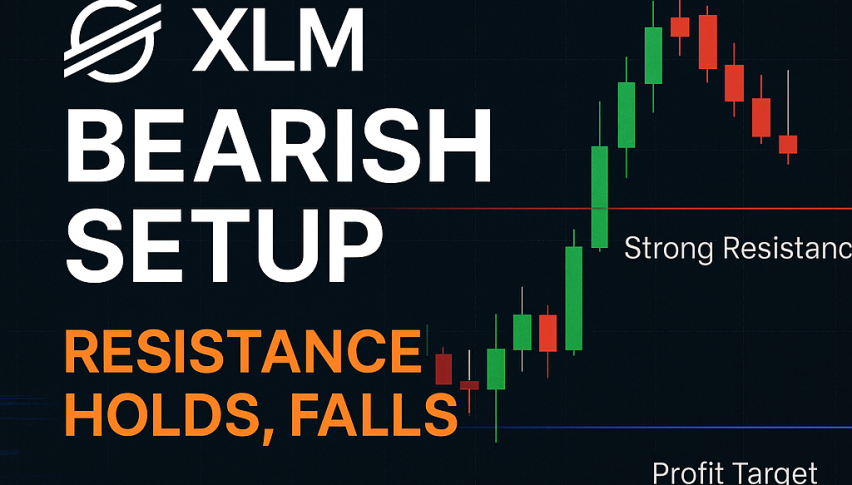
Support and Resistance Levels: Key support levels are at $0.23, $0.23, and $0.23, while resistance levels are at $0.23, $0.23, and $0.24. The pivot point is at $0.23, with Stellar trading slightly above it, suggesting potential support.
Technical Indicators Analysis: The RSI at 36.34 indicates a bearish trend. The ATR of 0.0109 suggests moderate volatility. The ADX at 24.169 shows a weak trend. The 50-day SMA and 200-day EMA do not indicate a crossover, suggesting a continuation of the current trend.
Market Sentiment & Outlook: Sentiment is currently bearish, as indicated by the price action relative to the pivot, RSI, and ADX. The lack of a moving average crossover and moderate ATR-based volatility further support this outlook.
Forecasting Returns: $1,000 Across Market Conditions
Investing $1,000 in Stellar presents various scenarios based on market conditions. In a Bullish Breakout scenario, a 10% price increase could raise the investment to approximately $1,100. In a Sideways Range, the price might remain stable, keeping the investment around $1,000. In a Bearish Dip, a 10% decrease could reduce the investment to about $900. These scenarios highlight the importance of market timing and sentiment analysis. Investors should consider diversifying their portfolios and setting stop-loss orders to manage risks effectively.
| Scenario | Price Change | Value After 1 Month |
|---|---|---|
| Bullish Breakout | +10% to ~$0.2584 | ~$1,100 |
| Sideways Range | 0% to ~$0.2344 | ~$1,000 |
| Bearish Dip | -10% to ~$0.2109 | ~$900 |
FAQs
What are the predicted price forecasts for the asset?
The daily closing price for Stellar is predicted to be around $0.2350, with a range between $0.2300 and $0.2400. The weekly closing price is expected to be approximately $0.2380, with a range from $0.2300 to $0.2450.
What are the key support and resistance levels for the asset?
Key support levels for Stellar are at $0.23, while resistance levels are at $0.23 and $0.24. The pivot point is at $0.23, with the asset trading slightly above it, indicating potential support.
Disclaimer
In conclusion, while the analysis provides a structured outlook on the asset’s potential price movements, it is essential to remember that financial markets are inherently unpredictable. Conducting thorough research and staying informed about market trends and economic indicators is crucial for making informed investment decisions.