Crypto Strategy: Relative Strength Index (RSI)
The Relative Strength Index (RSI) is a technical indicator designed to quantify the magnitude of a security’s pricing volatility. Considered to be a momentum oscillator, the RSI is used to identify whether or not a product is overbought or oversold. This task is accomplished by graphically plotting a single line with a value of 0 to 100. Generally, a market is considered to be overbought if its RSI measures above 70; a reading beneath 30 is commonly interpreted as being oversold.
Developed circa 1978 by Welles Wilder Jr., the RSI remains among the most popular public-domain indicators in circulation today. Due to the volatile nature of the cryptocurrency markets, the RSI is a go-to technical tool for legions of active crypto traders.
How Does The RSI Strategy Work?
At its core, the RSI is a momentum-based indicator that quantifies the respective magnitude of pricing volatility. It’s frequently applied on all products, specifically in the trade of shares, commodities, and cryptocurrencies. Also, like many other technical tools, the applications of RSI in forex trading are extensive.
To calculate the current RSI, two steps are needed. First, the average periodic gain or loss for a specific interval is derived and decimalised:
- RSI = 100 – [100/(1+ Average Gain/Average Loss)]
Second, a select number of periods is defined to aggregate the data set. Typically, a base value of 14 periods is used:
- RSI = 100 – [100/(1 + ((Previous Average Gain *13) +Current Gain)/-((Previous Average Loss * 13) + Current Loss))]
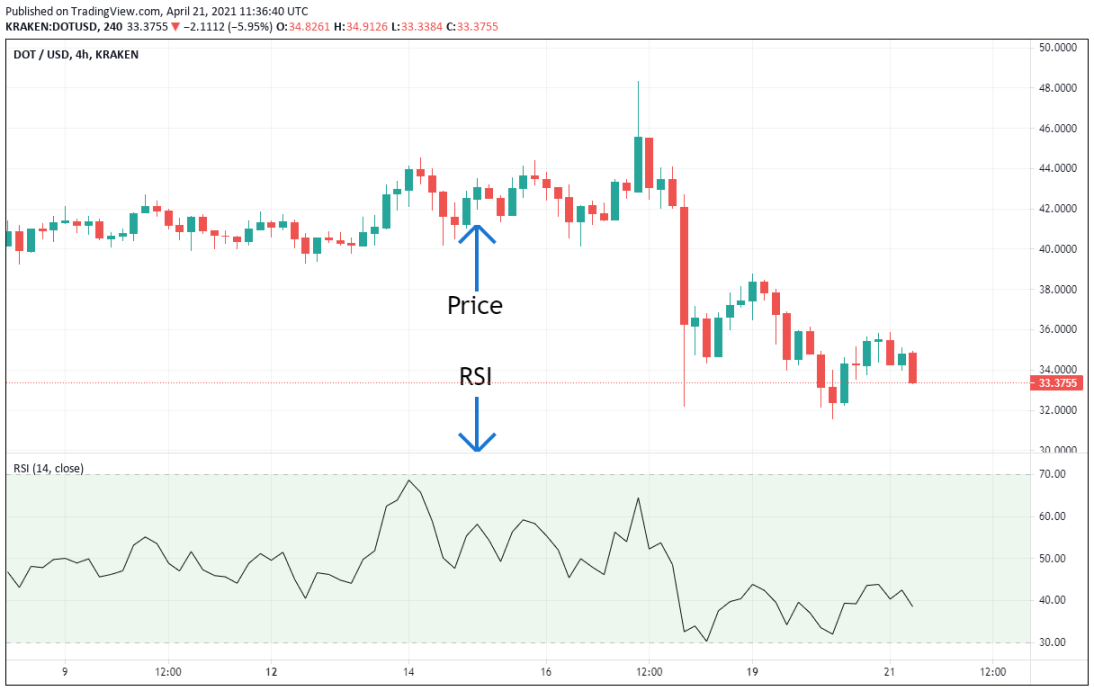
Confused? Don’t worry ― modern crypto trading platforms perform all calculations automatically. The RSI values are then graphed beneath price as a single line with a value ranging between 0 and 100. To interpret, all the cryptocurrency trader has to do is evaluate the RSI’s value. If it’s above 70, then the market is becoming overbought and may be ready for a reversal; if below 30, the market is becoming oversold and may be ready to bounce. It’s that simple.
How Is The RSI Strategy Used In Crypto?
The applications of the relative strength index are diverse in the cryptocurrency markets. First, the RSI may be applied to any coin offering on any timeframe. Second, the indicator is flexible, thus can be integrated into a variety of trading strategies. One can use the RSI to trade reversals, range-bound markets, or enter trending markets on price retracements.
The real beauty of the RSI is that it is inherently user-friendly. After applying the indicator to a cryptocurrency chart of choice, interpretation is straightforward. According to its creator Welles Wilder Jr., the RSI should be interpreted as follows:
- 0-30: The market is trending lower and is becoming oversold; it may be time to buy.
- 30-70: The market is neutral and trading sideways. In this case, it may be best to wait or employ a range-trading strategy.
- 70-100: The market is trending higher and is becoming overbought; it may be time to sell.
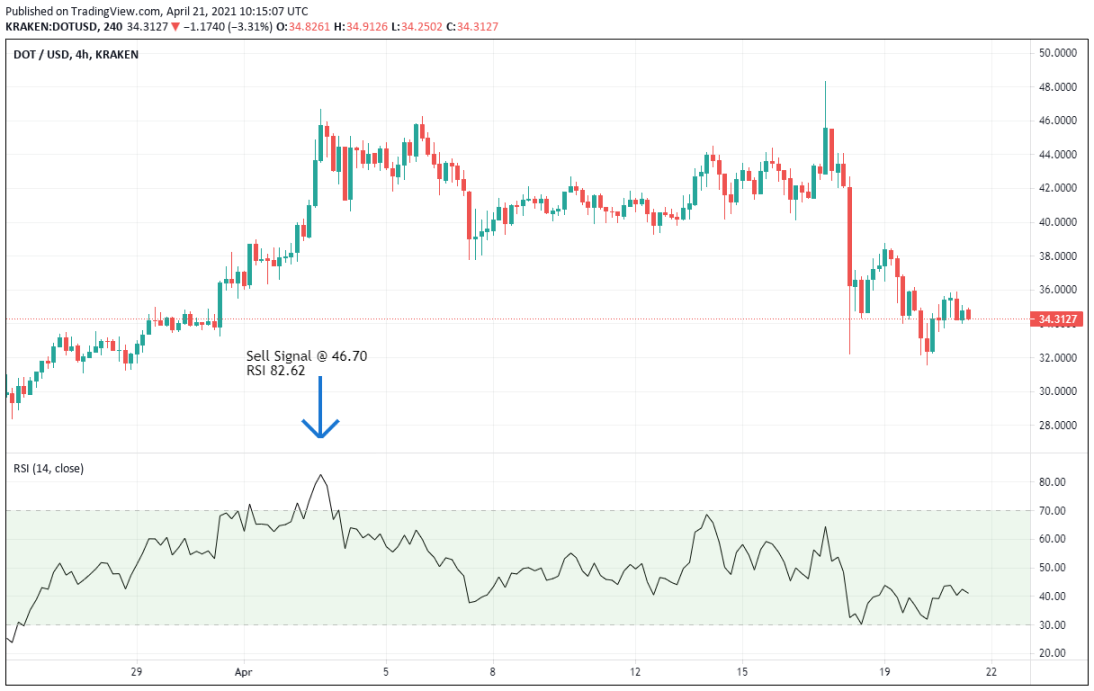
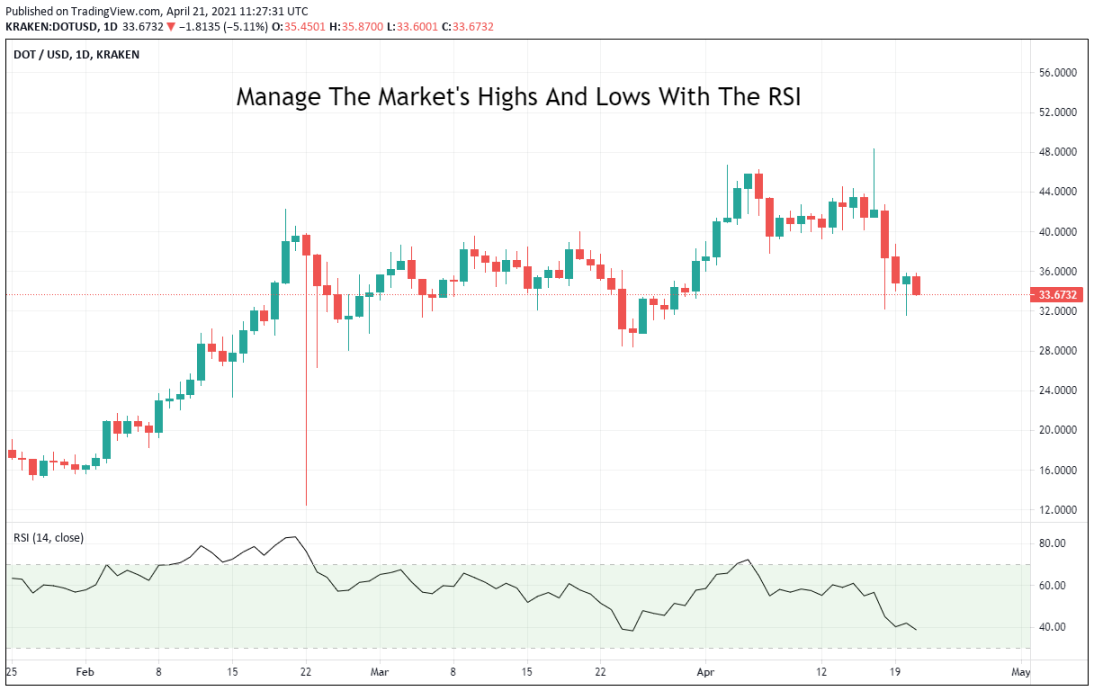
To illustrate how the RSI functions in the cryptocurrency markets, let’s take a look at the daily Polkadot (DOT) chart below. As you can see, on 3 April 2021, the RSI peaks, posting a value of 82.62. This value is well above the upper band of 70, thus a sell is warranted.
Things To Watch For When Trading Crypto With The RSI
Like all technical indicators, the relative strength index isn’t infallible. It’s important to remain cognizant of past and present performance while applying the indicator consistently. Below are three issues to be aware of when trading cryptos with the RSI:
- False Signals: Unfortunately for active crypto traders, the RSI does have a tendency to generate false signals. A false signal, or “fake out,” occurs when RSI readings rise above 70 or fall below 30 and price fails to reverse. This phenomenon is commonly found in cryptocurrencies that are in the midst of a strong trend. As a result, false buy or sell signals are created as the bullish or bearish price action fails to reach exhaustion. In order to remedy this drawback, the RSI is best used in conjunction with other technical or fundamental indicators. For instance, many traders combine the RSI with Bollinger Bands, moving averages, or Fibonacci retracements to improve the indicator’s efficacy. No matter which cryptocurrency is being traded, it’s a good idea to add at least one additional indicator to the RSI-based strategy.
- Reversals: Ultimately, the relative strength index was designed to be a device for identifying trend exhaustion and market reversals. A market reversal occurs when the price action of a prevailing trend becomes exhausted and poised for a change in direction. One of the benefits of trading reversals are the exceedingly positive risk vs reward setups available; payoffs of 300%, 400%, or 500% are not uncommon in the cryptocurrency markets. The guidelines for trading reversals with the RSI may be viewed with respect to the standard 70/30 parameters. However, many traders often view RSIs above 80 to be ideal for bullish exhaustion and below 20 for bearish exhaustion. Further, it is useful to incorporate various time frames including intraday, daily, and weekly charts into the analysis. In doing so, one can use the RSI to identify overbought or oversold conditions on both macro and micro levels.
- Risk Management: No matter what product or strategy being traded, implementing prudent risk management parameters is integral to success. And, given the volatility of the cryptocurrency markets, risk management is increasingly important. Remember, the RSI is only a technical indicator ― it’s not gospel. The only way to ensure that it works effectively is through consistently applying the strategy over the long-run; if this is done, then profit and loss become products of reality, not luck. One strong risk management strategy is to never risk more than 3% of the account balance on a single cryptocurrency trade. Known as the “3% rule,” this approach preserves the trading account while pursuing profitability.
Predicting Crypto Prices With The RSI
By far, the single greatest task in the world of finance is accurately forecasting future price movements. Crypto price prediction is exceedingly difficult as a myriad of factors impact asset values on a continuous basis. Rumours, hacking, and government regulation can quickly sway values.
It’s important to remember that the RSI isn’t designed to predict exact prices ― it’s designed to project a change in the market’s direction. So, thinking of a cryptocurrency as being overbought or oversold with respect to the RSI is useful. Simply put, if the RSI is over 70, prices are likely to fall from current levels; if below 30, price is positioned to rise.
Pros And Cons Of The RSI
| Pros | Cons |
| May be used on any crypto asset | Trending cryptos can create an abundance of false signals |
| Is functional on any cryptocurrency chart duration, from intraday to yearly | The RSI relies on average cryptocurrency price ranges, thus sudden volatility can produce misleading values |
| Easily configured, applied, and interpreted | On cryptocurrency charts with longer time periods, trading signals can be rare |
Common Mistakes To Avoid When Using The RSI
No strategy is foolproof. When using the relative strength index, it’s important to avoid the following pitfalls:
- Ignoring Fundamentals: No matter which cryptocurrency you are trading, it’s always a good idea to stay aware of market fundamentals. Surprise news items, government regulation, or hacking events can all render the RSI ineffective.
- Bad Money Management: Adhering to strong risk and money management principles is the key to trading the RSI successfully. Don’t bet it all one trade ― preserve capital and play for the long-run.
- Emotional Trading: It’s important to approach crypto trading in a measured, even-keeled, and disciplined manner. If not, falling victim to overtrading and haphazard leveraging becomes probable.
Get Started!
If you’re ready to take the plunge into the exciting cryptocurrency markets, the RSI isn’t a bad place to begin. It’s easy to use and readily available on most software trading platforms. Through a bit of study, practice, and commitment, you can become fluent in trading the RSI in no time!
Sidebar rates
